|
|
|
|
Membrane mechanical homeostasis, tension regulation, area regulation and mechanosensitive membrane traffic are all used to describe membrane-reservoir exchange, a phenomenon that complicates membrane mechanics, osmosis and cellular osmotic response.
Some cell membranes, when exposed to increased tension, increase their area by incorporating new membrane material from a reservoir. Conversely, when the tension is sufficiently low, they may delete material from the membrane, and thus sometimes regain their original shape after, for example, osmotic contraction. One important consequence is the lysis of cells during cycles of osmotic contraction and expansion.
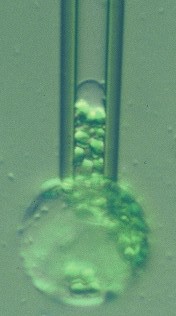
The figure at right shows a plant protoplast (from a rye leaf) in a micropipette. Large changes in area can be imposed by osmotic pressure variation or by micropipette aspiration (as here). These and some other cells survive huge variations in membrane area: how do they survive these variations without lysis?
Colleague Peter Steponkus and I proposed the mechanosensitive mechanism in the early 1980s. In this page we reproduce some of the data that led us to this model, including plots of how the incorporation rate depends on the membrane tension. We also list the original papers, some of them available in .pdf format.
This phenomenon has recently been observed in a range of cell types. Following its more recent observation in mammalian cells, there has been increased interest in the phenomenon, and it has been given a variety of new names.
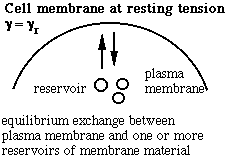
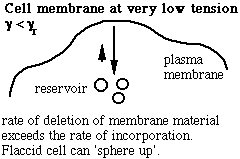
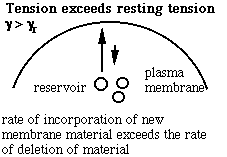
Schematic of the membrane-reservoir exchange at different values of membrane tension. (Vesicles are not the only reservoir: membrane folds or rafts are other possibilities, as are tethers linking the membrane to internal membrane structures, potentially including blebs. Monomers of membrane material are also a possible reservoir, but the rates of monomer exchange would probably be very slow for living membranes.)
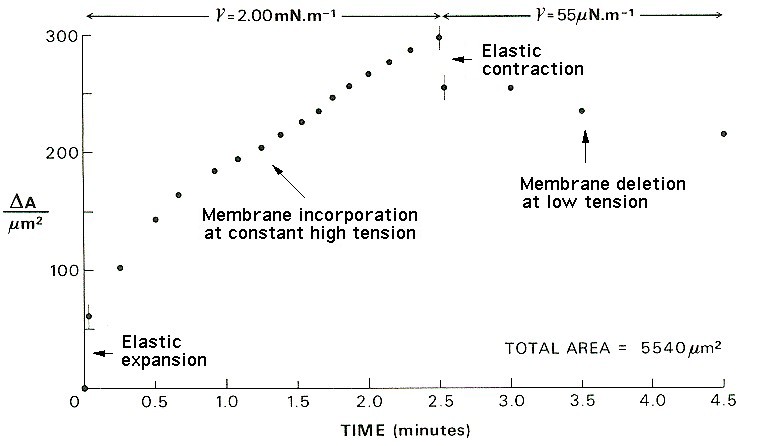
Response of the cell membrane area to step increase, constant high tension, step decrease and constant low tension, imposed with a micropipette.
For the results shown in the figure below, also from Wolfe & Steponkus (1983), the membrane tension was increased to a value close to the level required to rupture it. Thereafter, the suction in the pipette was adjusted so as to keep the membrane area constant. The tension falls rapidly at first, because the rate of incorporation into the membrane is high. The incorporation of new material reduces the stretching and so lowers the tension, so the rate of incorporation gradually falls over time.
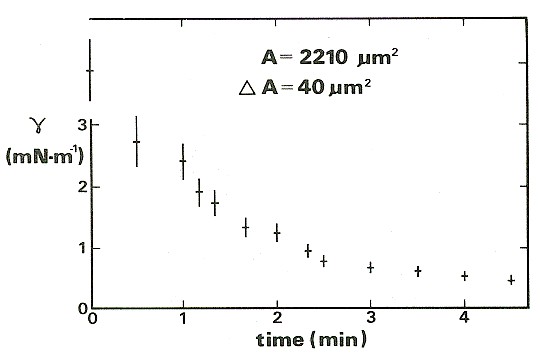
Relaxation of the membrane tension and approach to equilibrium in a cell maintained at constant area using a micropipette.
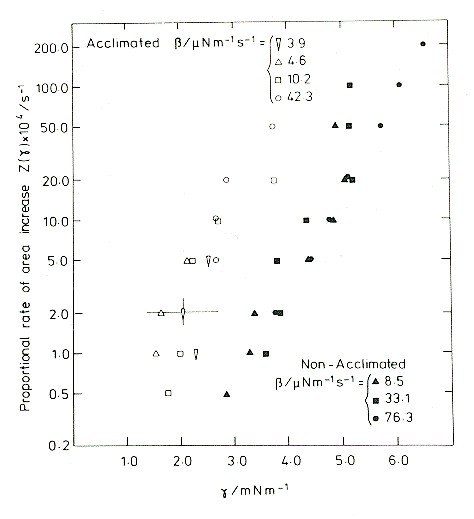
Membrane incoroporation rate as a function of tension.
The data on this semilog graph fall approximately in straight lines. So, over this range of tensions, the rate of incorporation of new material increases approximately exponentially with tension. The vertical scale covers the range 0.002% per second to 2% per second, but the tensions required to produce the latter rate are quickly fatal. Indeed, all of these experiments ended in rupture, which determined the upper limit of tensions measured. There are two data sets: the filled symbols are for protoplasts obtained from rye seedlings grown under mild conditions, and the open symbols for protoplasts obtained from seedlings that had been cold acclimated. The acclimated plants were frost resistant, and their tissues were able to withstand a freeze-thaw cycle. Protoplasts extracted from the acclimated plants were better able to withstand a large cycle of osmotic contraction and expansion, such as is produced in the extracellular medium by a freeze-thaw cycle.
What is the reservoir and what are the mechanism and kinetics for exchange? We suggested cytoplasmic vesicles (larger ones might be tethered to the membrane) and submicroscopic membrane folds and extrusions. For simpler systems such as artificial bilayers, thermodynamic equilibration is possible, and we describe these for such systems (Gruen and Wolfe, 1982; Wolfe, 2015). However, the mechanisms involved in living cells may not be equilibrated under most conditions and the exchange process may be complicated.
So how did this phenomenon affect protoplasts and what are its implications for freezing tolerance? As shown in the previous figure, protoplasts from acclimated seedlings incorporated membrane material at a much greater rate, for any given membrane tension, than did those from non-acclimated plants. This explains their increased frost resistance. The reservoirs of the two were different: internal vesicles for the normal, and exocytotic extrusions for the acclimated. The next step was to analyse the problem quantitatively.
.gif)
A schematic of solving the freezing survival problem.
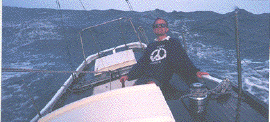
Joe Wolfe, School of Physics, The University of New South Wales, Sydney
This work was done when I was a postdoc with the late Peter Steponkus at Cornell University. Michael Dowgert was a PhD student at the time, and he carried on the project after the Ithaca winters drove me back to Oz.
| © 2005. Modified 27/1/05 J.Wolfe@unsw.edu.au, phone 61-
2-9385 4954 (UT + 10, +11 Oct-Mar). Joe Wolfe, School of Physics, University of New South Wales, Sydney, Australia.
|
|
|
|

 Joe's scientific home page