Speech science has a long history. Voice acoustics is an active area of research in many labs, including our own, which studies the science of singing, as well as the speaking voice. This document gives an introduction and overview. This is followed by a more detailed account. Throughout, a number of simple experiments are suggested to the reader. As background, this link gives a brief multi-media introduction to the operation of the human voice.
A common simplification is the Source-Filter model, which considers the voice as involving two processes: the source produces an initial sound and the vocal tract filter modifies it. For example, at the larynx (sometimes called ‘voice box’), we produce a sound whose spectrum contains many different frequencies. Then, using tongue, teeth, lips, velum etc, (collectively called articulators) we modify the spectrum of that sound over time. In this simple introduction to the voice, we discuss the operations of first the ‘source’ of the sound, then of the ‘filter’ that modifies its spectrum, then of interactions between these. In a second part, we then return to look at the components in more detail.
The source
There are several sources of sound in speaking. The energy usually comes from air expelled from the lungs. At the larynx, this flow passes between the vocal folds and through the vocal tract, sometimes encountering constrictions.
In voiced speech, the vocal folds (sometimes misleadingly called ‘vocal cords’) vibrate. This allows puffs of air to pass, which produces sound waves. Here is the first of a series of Experiments (colour coded thus in the text): place your fingers on your neck near your larynx (on your ‘Adam’s apple’) then sing or speak loudly. Can you feel the vibration? The vibrations produced in voiced speech usually contain a set of different frequencies called harmonics.
(See Sound spectrum.)
In whispering, the folds do not vibrate, but are held close together. This produces a turbulent (irregular) flow of air. This in turn makes a sound comprising a mixture of very many frequencies, which is called broad-band sound. This gives the ‘windy’ sound that is characteristic of whispering. Try some Experiments: can you whisper a note? What are the differences between speaking very softly and whispering loudly? Can you feel the vibration in your neck when you whisper? Can you sing in a whisper?
This observation invites us to divide speech sounds into two classes: voiced sounds, produced by vibration of the vocal folds, and unvoiced sounds, produced by other effects, such as whispering.
But unvoiced sounds occur in normal speech, too, as we'll now discuss. The basic unit (or element) of speech sound is a phoneme, such as a vowel or a consonant. There are approximately 44 phonemes in English — the number depends on accent.
In pronouncing some sounds, such as the ‘f’ and ‘ss’ in the word ‘fuss’, turbulence is produced elsewhere: at the constriction between teeth and lips in ‘f’ and between tongue and hard palate in ‘ss’. Both of these are unvoiced fricative phonemes. Compare these in the next Experiment: try sustaining these sounds while feeling for vocal fold vibration. The ‘p’ and ‘t’ in ‘pit’ are also unvoiced phonemes but here the source of sound is related to the sudden opening or closing of the air path.
These are called plosives. (Plosive and fricative consonants are examples of phonemes.)
Experiment: start to pronounce the word 'pit', but towards the end of the word, don't let your tongue leave contact with the hard palate. What does this tell you about the way air flow contributes to the production of the ‘t’ consonant?
If you slow 'pit' down a lot and exaggerate the 't', you can probably notice a silent gap before the end of the word. This may be a suprise. In the sentence 'put it up' there are three nearly silent gaps, one in each word. There is no silence between 'put' and 'it' or between 'it' and 'up'.
You might want to record the sentence and look at the sound track. Experiment: in a recording of that sentence or another containing plosives, use the sound editor to expand the silent gap, then play the sentence back to identify where the gap occurs.
Some voiced phonemes, such as vowel sounds in normal speech, use vibrations of the vocal folds with relatively little turbulence. In others, such as the ‘v’ and ‘z’ in ‘viz’ or the ‘b’ and ‘d’ in ‘bid’ combining both the sound from the larynx and the sound from the constriction. Another Experiment: In whispered speech, by definition, no phonemes are voiced, so the differences between ‘pit’ and ‘bid’ disappear. Listen for the difference in normal and whispered speech. Try whispering ‘pit’ and ‘bid’ out of context to a friend, or record the words and see whether you can tell the difference. Then try some more examples using this table.
vowels
fricatives
plosives
voiced
normal vowels
z j v
b d g
unvoiced
whispered vowels
ss sh f
p t k
The table compares some pairs of phonemes that are pronounced with (nearly) the same articulation either with vocal fold vibration (voiced) or without vibration (unvoiced).
In fricatives, the tract is so constricted (by tongue, palate, teeth, lips or a combination) that sustained turbulent flow contributes broad-band sound to the spectrum. Plosives involve opening and/or closing of the tract with the lips (p, b) or the tongue (t, d; k, g) at different places of articulation. The sudden opening or closing and associated turbulence briefly produce broad-band sound in plosives. Experiment: “Record some of the phenomes in the above chart and observe the waveforms associated with each. Their spectrograms are also very informative (as we'll see in the next section and also in Different registers and vocal mechanisms).
The filter
The sound produced by the source is changed by the filter: depending on how you position your tongue and the shape of your mouth opening, different frequencies will be radiated out of the mouth more or less well. As a result, the sound will be different. Another Experiment: sing a sustained note at constant pitch and loudness, while varying the opening of your mouth and the position of the tongue. This will allow you to produce most of the vowels of English and some other phonemes (called approximants), such as the ‘ll’ in ‘all’ or the ‘r’ in ‘or’, as pronounced in some accents.
How you position your velum (soft palate) also makes a difference. In the normal (high) position, all of the air and sound goes through the mouth. Lower the velum and you connect the nasal pathway to the mouth and lower vocal tract. Lower it further and you seal the mouth off from the pathway from nose to larynx. For the next Experiment, observe the differences between a nasal sound (such as the 'ng' in 'sing') and a non-nasal one (‘ah’), then try sealing and unsealing your nose with your fingers, and also opening and closing your mouth, which will tell you how completely your velum seals one of the pathways. (If you are not alone, and if you've been doing all of these experiments, you may notice some strange looks.)
Vowels
To a large extent, vowels in English are determined by (i) how much the mouth is opened, and (ii) where the tongue constricts the passage through the mouth: front of the mouth, back or in between. One can map the vowels in terms of these articulatory details, or in terms of acoustic parameters that are closely related to them. Here are maps for two different accents of English.
The frequencies on the axes correspond to bands of frequencies that are strongly radiated. (These are called formants, about which more later.) The vertical axis on these graphs roughly corresponds to the jaw position (high or low) or the size of the lip opening. The horizontal axis corresponds to the position of the tongue constriction.
Vowel planes for two accents of English (Ghonim et al., 2007, 2013). These data were gathered in a large, automated survey in which respondents from the US (left) and Australia (right) identified synthesised words of the form h[vowel]d: a form in which most examples are real words. ‘short’ and ‘long’ indicate that more than 75% of the choices fell in these categories.
Vowels and some other phonemes may be sustained over time: for them, the position of the articulators (and so the values of the well-radiated frequency bands) is relatively constant. Experiment: try holding the vowel in 'who'd' and slowly evolving it to that in 'hard' and back again. Can you feel (or see in a mirror) the aperture between your lips changing? Can you do it without moving your tongue? Wihtout changing the lip aperture? Now try 'head' to 'hoard' and back. Can you do that without moving your tongue? Without changing the lip aperture?
Consonants
For other phonemes (such as the ‘p, b, t, d’ discussed above), the change in articulation over time is important. Consequently, so are the variations with time of the associated frequency bands, as is the broad-band sound associated with the opening or closing (Smits et al., 1996; Clark et al., 2007). In the examples ‘p, b, t, d’, the mouth opening is obviously changing during the consonant. Experiment: try slowing down (a lot) the motion of opening and closing of the lips in the word 'bab' and see if you notice what seems like a change in the vowel.
Like vowels, liquids (r and l) and nasal consonants (n, m, ng, gn) can be voiced or unvoiced and like vowels they have a characteristic set of peaks in the sound spectrum. For these, the tongue provides a narrower constriction.
In speech, vowels are in one sense less important than consonants: you can often understand a phrase even –f –ll v–w–l –nf–rm–t–n –s –bs–nt. On the other hand, vowels are more important in singing, because the vowel is often extended in time to produce a note, and sometimes decorated with loudness variations, vibrato or a trill.
Source-filter interactions
The conceptual separation of the voice function into source and filter is useful in describing some behaviour, but one should remember that the distinction is incomplete: the filter affects the source, and the source affects the filter. For instance, the geometry of the vocal folds affects not only the operation of the folds and thus the source, but also affects the acoustic properties of the filter. The geometry of the vocal and nasal tracts determines how they filter the sound, but the acoustical properties resulting from this geometry appear to affect the operation of the vocal folds. We talk about these complications below.
Contrasting the voice with wind instruments
If we neglect the influence of the articulators on the larynx, we have the simple version of the Source-Filter model. Superficially, it may seem obvious to a singer that the larynx and the articulators are largely independent: to many singers, particularly men in the low range, it feels as though we can vary the pitch (~ the source) and vowel (~ the resonator/ filter) independently. (This perception of independence may be an illusion resulting from our long familiarity with controling pitch and vowel in various combinations.)
In contrast, an analogous argument would seem a very odd approximation to someone who plays brass instruments. A trombonist knows that the resonances in the bore of the instrument (~ the resonator/ filter) do indeed affect the motion of the player’s lips (~ the source). In fact, a brass player’s lips generally tend to oscillate at or very near one of the frequencies of resonances in the bore. (See Acoustics of Brass Instruments.) We shall return to this below in Source-filter interactions, but let’s first note the following important quantitative difference between the two.
A trombone has a range that overlaps that of a man’s voice. However, the trombone is longer (a few metres) than a man’s vocal tract (~ 0.2 m). Somehow, I have a trombone range voice inside a piccolo-sized instrument! The range of fundamental frequencies of the trombone lies within the range of the trombone's resonances. The range of the voice, especially of a man’s voice, usually lies well below the frequencies of the vocal tract resonances. You are probably thinking that this difference – and therefore the approximation that the resonator doesn't affect the source – is most questionable for high pitches, when the fundamental of the voice enters the range of vocal tract resonances. You're right, and we’ll come back to this.
The Source-Filter model and approximations
In the (simplest version of the) Source-Filter model (Fant 1960), interactions between sound waves in the mouth and the source of sound (usually the glottis) are neglected. Although oversimplified, this model explains many important characteristics of voice production.
The figure below is an experimental illustration of the Source Filter model, using 3D-printed models of two configurations of a vocal tract, corresponding to the vowels in the words 'had' and 'heard'. (Click on diagram for a higher resolution version.) The source – the periodic laryngeal flow – was synthesised, then measured as it was input to the model tracts.
Because the laryngeal flow is periodic, its spectrum is made up of harmonics. The output at the 'lips' was also measured. They are shown below in both the time and frequency domains. The gain functions (the transpedance) of the tracts were measured independently and also plotted.
Notice how the formants, or peaks in the output sound (F1 to F4/F5) correspond approximately to those in the transpedance (which quantifies the gain of the tract as a function of frequency). These peaks in the output are closely related to the resonances of the vocal tract, and the resonant frequencies depend on the geometry of the vocal tract in the geometry that produces a particular sound. Notice too that the output sound is periodic, but that it is difficult to identify other features in the time domain.
(Wow, isn't that amazing? You carefully adjust the internal geometry of your throat to produce resonances at certain values, you pass a complex wave through that acoustic duct so that some of its frequencies are boosted and preferentially radiate and the result is ... ah!)
As noted, the measurements above use 3D printed models of the tracts (and indeed, books and papers on phonetics
usually just show cartoon sketches). Is it possible to use direct measurements on real vocal tracts? The answer is that we can't do it directly. However, we can make indirect measurements. We can’t measure the flow spectrum through the larynx, but we can measure the vibration of the vocal folds. Here, we do that using an electroglottograph (EGG): we apply a small radio frequency voltage across the neck using skin electrodes at the level of the vocal folds. The magnitude of the current that flows varies as the folds come into contact and separate. The spectra and sound files at the top of the figure are an EGG signal. Below that, we show the results of measurements of the resonances of the vocal tract, made at the mouth, during speech. This gives a quasi-continuous line whose peaks identify the resonances. It also shows the harmonics of the voice. (We discuss this technique here.) Below that are the spectra measured for that particular vowel, in the same gesture.
Here we contrast measurements of two vowels from a live human vocal tract. At left is the vowel [3], as in ‘heard’ (like one example used in the preceding figure). At right, [o], as in ‘hot’. The top graphs and sound files are for experimental measurements of the vocal fold contact (EGG). Note that this measurement of the source shows little difference between the two vowels: the filter has at most little effect on the source. The next pair of graphs are measurements of the vocal tract, made from the mouth, during the vowel. (More on this technique here.) The broad peaks identify resonances of the vocal tract, the sharp lines superposed are the voice harmonics. Here, because the tract is in a different configuration for the two vowels, the resonances occur at different frequencies, which are not harmonically related. The next two rows show the voice output for voiced speech and for whispering, measured in the same vocal gesture. More detail on these examples here.
So, to summarise, the spectrum of the output sound depends on the spectrum of the laryngeal source, on the frequency-dependent ‘gain’ of the vocal tract, including how well the sound is radiated out from the mouth and nose into the external sound field near the head. And as we've warned above, it also depends on interactions among these. We shall discuss these in the more detailed sections below.
Some difficulties
Before we leave this brief overview, it is worth noting that there is still much about the voice that is still incompletely understood. One reason for this is the ethical and practical difficulty involved in doing invasive experiments on humans. Some important data are impossible or difficult to measure while the voice is operating, e.g., the gain function of the vocal tract and the mass and force distributions in the vocal folds.
For most human physiology, much information has been obtained from other species, whose organs function in similar ways. When it comes to the voice, however, there is no such similar species – no-one is very interested in the voice of the lab rat. Much of our knowledge comes from experiments using just the sound of the voice as experimental input. Other knowledge comes from medical imaging. Another approach is to use a mathematical model: one can treat the vocal folds as collections of masses on springs, and the vocal tract as an oddly shaped pipe that transmits sound. The next step is to solve the equations for this simple system and to predict the sound it would make, and to see how this correlates with sounds of speech or singing. Another is to make artificial systems with the shape of the vocal tract and some sort of aero-mechanical oscillator at the position of the glottis. Yet other knowledge comes from other experiments and observations that are often, for practical and ethical reasons, somewhat indirect. Because of the importance of the human voice, these are all active research areas.
We now look more closely at some of the topics introduced above. Other reviews are given by, for example, Lieberman and Blumenstein, 1988; Titze, 1994; Stevens, 1999; Hardcastle and Laver, 1999; Johnson, 2003; Clark et al., 2007; Wolfe el al, 2009; Zhang, 2016; Garnier et al, 2020. References are given below.
The source at the larynx
To speak or to sing, we usually expel air from the lungs. (Singing during inhalation is possible but usually rather less beautiful.) The air passes between the vocal folds, which are muscular tissues in the larynx. If we get the air pressure and the tension and position of the vocal folds just right, the folds can vibrate at a frequency desired for speech or singing. The larynx then becomes an oscillating valve, letting puffs of air flow into the vocal tract. Usually, the oscillation is close to periodic, and we call itsat some frequency fo.
These sketches illustrate the larynx, viewed from above, in position for phonation and for breathing.
In technical terms, to produce vibrations we must use our arytenoid cartilage to restrict our vocal folds to a narrower position than in normal breathing. This is called adduction (Scherer 1991). This reduced aperture between the folds is called the glottis. (The glottis may be wide open for breathing and some unvoiced sound, closed for sealing air in the lungs and stiffening the torso, narrowed for whispering and vibrating for speech and singing.) Compared with the broad glottal aperture used for breathing, the narrow glottis restricts the flow of air, which often leads to a greater steady pressure drop across the larynx. A higher pressure drop means that the speed of air (in metres per second) through the glottis is high, even though the small cross section means that the volume flow (in litres per second) produced by a given lung pressure is less. (More about the relation between flow and air speed here.)
Experiment: take a deep breath and time how quickly you can breathe it out completely with your larynx relaxed. Now do the same, while pronouncing a whispered ‘ah’ and singing a (loud) ‘ah’. Which breath lasts longest (i.e. which has the lowest flow)? If you have gone from a large inhalation to maximum exhalation, you have probably expelled about five litres. Divide that by the time taken to get the flow rate. (Again, more about this here.)
Muscles do not directly vibrate the vocal folds — they oscillate typically at over 100 vibrations per second, so too fast for direct muscle action (Van den Berg, 1958). Rather, the energy required to start and to maintain the oscillation is extracted from the energy of the air flow through the larynx and the pressure difference across it. Several different effects are thought to be involved. These simplified schematics sketch the vocal folds in cross section, seen from in front. The average pressure below the folds (the pressure supplied from the lungs) is greater than the average pressure above the folds, which is close to atmospheric. In (a), the folds are closed and the pressure below the folds tends to force them upwards and apart, in that order (b, c). The tissues are elastic and under tension so, when stretched, they tend to return to their starting position (d, a).
How can this extract energy from the air flow? Different effects can contribute, as we'll discuss.
First, consider the air pressures. During phonation, the pressure inside the glottis (i.e. between the folds) must usually be rather lower than the pressure below the glottis because that pressure difference has accelerated the air to produce a high-speed air jet: the blue arrow in (b) above. (This is due to Newton's second law and is sometimes called the ‘Bernoulli effect’.) As the jet of air leaves the glottis, it loses much of its kinetic energy in turbulence, so it doesn't regain its high pressure when it slows into the broader cross-section of the vocal tract.
One effect arises when the fold motion involves a surface wave (Titze, 1988), as suggested in this highly simplified sketch. Here, the motion of the folds (red outlines) is lateral, but varies as a function of height: the lateral vibration in the top of the folds is out of phase with that in the bottom. In sketch (i), the glottis is broader at the bottom, with the consequence that the average pressure in the glottis is closer to the sub-glottal pressure P1, which is high and so can push the folds apart, stretching them against their elastic forces. Later in the cycle (sketch ii), the glottis is broader at the top, so the average pressure in the glottis is closer to the supra-glottal pressure P2, which is lower than P1 and therefore may be overcome by the elastic forces that act to bring the folds back together. The lower level then opens and the cycle repeats, driven by air pressure difference.
Another effect that converts energy for auto-oscillation is the sweeping motion of the vocal folds shown in another very simplified sketch below. Again the red outlines are the folds at a given time, and the grey outlines show their previous positions. The upwards motion of the folds (i to ii) starts before they separate (ii to iii), so the folds are more separated when they descend (iii to iv) (George et al, 2008). This difference in phase between the vertical and horizontal components of that motion has the result that a steady pressure difference across the folds can do work on them, replenishing energy lost in the collision between folds that occurs once per cycle (Boutin et al., 2015).
A steady pressure difference P1−P2 does work on the folds because the upwards motion sweeps more air volume than the downwards — the grey triangle in (ii) is bigger than that in (iv). The volume changes indicated by the stippled shading involve negligible work because the pressures in both regions are approximately P2.
The surface wave effect has been more studied than the sweeping effect. This is in part due to the lateral fold motion being easier to measure than the vertical motion, but see George et al (2008).
Depending on the acoustic impedance of the tracts above and below the folds, and on passive mechanical and geometric properties of the tissue, these different effects in various combination can lead to
self-sustained oscillation. Much has been done in this area and research continues. See Helmholtz, 1877; Van den Berg, 1958; Flanagan and Landgraf, 1968; Fletcher, 1979; Awrejcewicz, 1990; Fletcher, 1993; Elliot and Bowsher, 1982; Titze, 1988; Titze, 1994; Adachi and Yu, 2005; Boutin et al., 2015; Zhang, 2016.
So, muscles do not directly vibrate the vocal folds. However, muscles in the larynx contribute to the control of vibration, by determining how much the folds are pushed together and how much they are stretched along their length. If you get these parameters right, and hold them steady, you can produce a note with a fixed pitch, which means that the folds are vibrating in a regular, periodic way. That’s what we (usually) do in singing. In normal speech, however, the pitch typically varies throughout a phrase and during each syllable, usually in a smooth way.
The fundamental frequency for speech ( fo) is typically 100 to 400 Hz. For singing, the range may be from about 60 Hz to over 1500 Hz, depending on the type of voice. The speed of sound c is about 340 m.s−1, so the wavelengths of the fundamentals (λ = c/f, where c is the speed of sound) are roughly 1 to 3 metres, but can be as short as 0.3 m or less for high-pitched singing. So here is an important point: the wavelength is usually, but not always, rather longer than the vocal tract itself, which is typically 0.15-0.20 m from mouth to glottis. As noted above, this makes the voice very different from typical musical instruments: in the artificial instruments, a resonance of the bore largely controls the pitch. For the voice, the resonances of the vocal tract rarely control the pitch. Rather, the pressure provided by the lungs and the tension in the vocal folds together largely determine both loudness and pitch. Experiment: sing a sustained note softly at first, then smoothly getting much louder, then softer. Try to keep the pitch very constant. You have just performed what singers call a messa di voce. Because pressure and tension both contribute to pitch and loudness, it's not easy, and is a regular exercise for many singers.
Different registers and vocal mechanisms
So, how do we cover a wide range of pitch with a single, small vocal tract? Let’s continue the contrast with musical instruments (See Standing Waves for a discussion). On a violin or guitar, one can change the length of a string, but to cover a large range, one can also cross to a new string (see Waves on a string). In trumpet, trombones, clarinets, flutes etc, one can change the length of a pipe (with valves, a slide or keys) but one can also change registers, which means changing the operating resonance (or mode of vibration) in the pipe.
In the voice, we can change the muscle tension and the pressure to vary the pitch. However, to cover a range of a few octaves, we usually need to use different voice registers (Garcia, 1855). The distinctions among registers in singing are not always clear, however, because changing registers corresponds to both laryngeal and vocal tract adjustments (Miller, 2000).
The vocal folds can vibrate in (at least) four different ways, called mechanisms (Roubeau et al., 2004; Henrich, 2006).
Mechanism 0 (M0) is also called ‘creak’ or ‘vocal fry’. Here the tension of the folds is so low that the vibration is not periodic (meaning that successive cycles of the vibration have substantially different durations). M0 sounds low but has no clear pitch (Hollien and Michel, 1968). Experiment: if you hum softly the lowest note you can and then go lower, you will probably produce M0. If you have spectrum analysis software, it's interesting to look at spectra or spectrograms of such experiments.
Mechanism 1 (M1) is usually associated with what women singers call the ‘chest’ register and men call their normal voice ('modal' voice for singers). This is used to produce low and medium pitches. In M1, virtually all of the mass and length of the vocal folds vibrates (Behnke, 1880) and frequency is regulated by muscular tension (Hirano et al., 1970) but is also affected by air pressure. The glottis opens for a relatively short fraction of a vibration period (Henrich et al., 2005).
Mechanism 2 (M2) is associated with the ‘head’ register of women and the‘falsetto’ register in men. It is used to produce medium and high pitches for women, and high frequencies for men. In M2, a reduced fraction of the vocal fold mass vibrates. The moving section involves about two thirds of their length, but less of the breadth. The glottis is open for a longer fraction of the vibration period (Henrich et al., 2005).
Mechanism 3 (M3) is sometimes used to describe the production of the highest range of pitches, known as the ‘whistle’ or ‘flageolet’ register (not to be confused with whistling) (Miller and Shutte, 1993; Garnier et al, 2010; 2012.)
Although some people use M0 in speech, especially at the end of sentences, and coloratura sopranos use M3 in their highest range, speech and singing usually use M1 and M2. Men's singing voice ranges are typically about an octave lower than women's (conservatively, about F2 to G4 and F3 to G5, respectively). However, in spite of this difference, both men and women typically change from M1 to M2 at about 350-370 Hz (F4-F#4) (Sundberg, 1987), which is often called a 'break' in the voice. Consequently, with their lower overall range, men typically use M1 for nearly all speech and most singing. However, in some styles of pop music and some operatic styles, men use M2 extensively: men who sing alto are usually using M2. For women singers, the situation depends on vocal range. Sopranos sing in M2 and usually extend its range downwards to avoid the 'break' over their working range. High sopranos may use M3. Altos often use both M1 and M2, carefully choosing where in the music to place the 'break'. Most women speak in M1, but some use M2.
There is usually a pitch and intensity range over which singers can use either M1 or M2 (Roubeau et al., 2004), and trained singers are good at disguising the transition. Sometimes, as in yodeling, the transition is a feature. Experiment: if you try to produce a smooth pitch change or portamento over your whole range. Unless you are an accomplished tenor or alto, you will probably notice a discontinuity: a jump in pitch and a change in timbre at a pitch somewhere near the bottom of the treble clef. This is where you change from M1 to M2. Roughly at the pitch of that break, you may also produce a break by singing a crescendo or decrescendo at constant pitch (see Svec et al., 1999; Henrich, 2006). Experiments: (i) find your own break and practise shifting it. (ii) Listen to a range of voices and try to identify which use which mechanism when.
Sketches of voice range profiles for a woman's and man's voice, with some registers indicated (from Garnier et al, 2020).
High sopranos often have a considerable overlap region for M2 and M3 (M3 is not shown in the figure above). Those that sing with M3 also use a different form of resonance tuning in the high range, which we discuss below. This gives a complicated set of possible strategies for singing in the high range (Garnier et al, 2010; 2012).
The next figure shows a spectrogram of a glissando through the four mechanisms.
A spectrogram plots frequency (vertical) against time (horizontal) with sound level in colour or grey-scale. This one shows the four laryngeal mechanisms on an ascending glissando sung by a soprano. Notice the discontinuities in frequency (clearer in the higher harmonics) at the boundaries M1-M2 and M2-M3. The horizontal axis is time, dark represents high power, and the horizontal bands in the broad-band M0 section clearly show four broad peaks in the spectral envelope. (Four formants, one near each tract resonance.) These may also be seen to varying degrees in the subsequent harmonic sections. This glissando in wav. Spectrogram above in .jpg.
Producing a sound
The processes that convert the ‘DC’ or steady pressure and flow from the lungs into ‘AC’ or oscillatory air flow and vocal fold vibration involve effects that are nonlinear. First, the pressure differences involved are often proportional to the square of the flow velocity (see this link). Second, the collision of the folds when the glottis closes is also highly nonlinear (Van den Berg, 1957; Flanagan and Landgraf, 1968; Elliot and Bowsher, 1982; Fletcher, 1993).
In science, linear just means that the equation is a straight line, so a change in one variable produces a proportional change in the other. We show elsewhere that an oscillator with a linear force law vibrates in a pure sine wave, which has just one spectral component. Conversely, anything with a nonlinear force law does not vibrate sinusoidally, and so has more than one frequency component. For some non-scientists, linear and nonlinear have been confused by postmodernism, where the words are used metaphorically.
Because of nonlinearities, the fold vibration is nonsinusoidal and has many frequency components. In M1, M2 and M3, the motion is almost exactly periodic, so the spectral components are harmonic: a microphone or flow meter placed at any point in the tract would indicate components at the fundamental frequency fo and its harmonics 2fo, 3fo etc, as shown in the figures above. (See sound spectrum for discussion of harmonic components.)
Overall, the amplitude of harmonics usually decreases with increasing frequency, though there are important exceptions. The negative slope in a plot of harmonic level vs frequency (this slope is called the ‘spectral tilt’) is different for different types of speech or singing (Klatt and Klatt, 1990). To varying extents, this negative slope is compensated by the response of the human ear, which is usually more sensitive to the higher harmonics than to the fundamental (see Hearing). More power in the high harmonics makes a sound bright and clear; weakening the high harmonics makes a mellow, darker or muffled sound. If you have a sound system with bass and treble or tone controls, or a sound editing program, you can experiment with strengthening and weakening the high harmonics using the treble or bass tone control. (Some filtered voice sound examples are here.)
A breathy voice has a spectrum with a strongly negative slope. This voice is produced when the vocal fold motion is not broad enough to close the glottis completely during the vibration cycle. Conversely, in loud speech or singing, which have a rapid closure of the vocal folds and a short open phase of the glottis (Childers and Lee, 1991; Gauffin and Sundberg, 1989, Novak and Vokral, 1995), the spectral envelope is flatter (the higher harmonics are less weak, the spectral tilt is less). This flatter spectrum has relatively more power in the frequency range 1–4 kHz, to which the ear is most sensitive.
It is possible to make high-speed video images of the vocal folds using an optical device (endoscope) inserted in either the mouth or nose (Baken and Orlikoff, 2000; Svec and Schutte, 1996). Electroglottography (Childers and Krishnamurthy, 1985), which is described above, is less invasive but less direct and gives less information. Although the flow through the glottis cannot be measured, it can be estimated from the flow from the mouth and nose, which can be measured using a face mask (Rothenberg, 1973) or from the sound radiated from the mouth. Both techniques require inverse filtering (Miller 1959), which in turn requires knowledge of, or assumptions about, the acoustic effects of the vocal tract and sometimes assumptions about the features of the waveform of the vocal flow one is aiming to measure.
Resonances, spectral peaks, formants, phonemes and timbre
As discussed above, acoustic resonances in the vocal tract can produce peaks in the spectral envelope of the output sound. In speech science, the word ‘formant’ is used to describe a spectral peak, but sometimes also the resonance that gives rise to it. In acoustics, it usually means the peak in the spectral envelope, which is the meaning on this site. We discuss the different uses in more detail on What is a formant?, and refer to this paper on nomenclature. But for the moment, note that ‘formant’ should be used with care.
Phonemes
In non-tonal languages such as English, vowels are perceived largely according to the formant frequencies F1 and F2 in the sound (Peterson and Barney; 1952, Nearey, 1989; Carlson et al., 1970), as we've seen above. F3 has a smaller role in vowel identification. F4 and F5 affect the timbre of the voice, but have little effect on which vowel we identify on hearing it (Sundberg, 1970). We repeat below the plots of (F2,F1) for two accents of English. Note that, in these graphs, the axes do not point in the traditional Cartesian direction: instead, the origin is beyond the top right corner. The reason is historical: phoneticians have long plotted jaw height on the y axis and ‘fronting', the place of tongue constriction, on the x. This choice maintains that tradition approximately.
These maps were obtained in a web experiment: listeners judged what vowel had been produced in synthetic words in which F1, F2 and F3 were varied, as well as the vowel length and the pitch of the voice
(Ghonim et al., 2007, 2013).
We repeat the figure showing the vowel planes for US and Australian English measured in an on-line survey (Ghonim et al., 2007).
The vocal tract as a pipe or duct
To understand how the resonances work in the voice, we can picture the vocal tract (from the glottis to the mouth) as a tube or acoustical waveguide. It has approximately constant length, typically 0.15-0.20 m long, a bit shorter for women and children. However, the cross section along the length can be varied by moving of the tongue, mouth etc. The frequencies of the resonances depend upon the shape. The frequencies of the first, second and ithresonances are called R1, R2, ..Ri.., and those of the spectral peaks or formants produced by these resonances are called F1, F2, ..Fi... (See this link for a discussion of the terminology.)
When pronouncing vowels, R1 takes values typically between 200 Hz (small mouth opening) to 800 Hz. Increasing the mouth opening gives a large proportional increase in R1. Opening the mouth also affects R2, but this resonance is more strongly affected by the place at which the tongue most constricts the tract. Typical values of R2 for speech are from about 800 to 2000 Hz. The resonant frequencies can also be changed by rounding and spreading the lips or by raising or lowering the larynx (Sundberg, 1970; Fant, 1960).
We’ll return to discuss this below, but for the moment, let’s note that, if the open end of a tube is widened, the resonant frequencies rise, which explains why opening the lip aperture raises R1 and F1. Similarly, reducing or enlarging the cross section near a pressure node respectively lowers or raises the resonance frequency. Conversely, reducing or enlarging the cross section near a pressure anti-node respectively raises or lowers the resonance frequency. This explains some features of the tongue constriction.
The nasal tract has its own resonances, and the nasal (nose) and buccal (mouth) tracts together have different resonances. The lowering the velum or soft palate couples the two, which affects the spectral envelope of the output sound (Feng and Castelli, 1996; Chen, 1997). (Understanding why takes a bit of work. See Standing Waves for the basic physics and Pipes and harmonics for example resonances.)
Nasal vowels or consonants are produced by lowering the velum (or soft palate, see Figure 1). The nasal tract also exhibits resonances. Coupling the nasal to the oral cavity not only modifies the frequency and amplitude of the oral resonances, but also adds further resonances. The interaction can produce minima (or antiformants or 'holes') in the spectrum of the output sound (Feng and Castelli, 1996; Chen, 1997).
Resonances, frequency, pitch and hearing
Some comments about frequency and hearing are appropriate here. The voice pitch we perceive depends largely on the spacing between adjacent harmonics, especially those harmonics with frequencies of several hundred Hz (Goldstein, 1973). For periodic voiced speech, the harmonic spacing equals the fundamental frequency of the fold vibration. However, the presence of a fundamental is generally not needed for pitch recognition (in speech or music): pitch comes essentially from the harmonic spacing (or the period of repetition in the pressure signal; the two are equivalent). Experiment: record a musical phrase, preferably fairly low, with at least some notes below middle C. Then filter it with a strong high pass filter (or filter several times) so as to remove the fundamental. Of course it will be much less bassy, but can you still recognise the correct pitch?
Except for high voices, the fundamental in speech usually falls below any of the resonances, and so may be weaker than one of the other harmonics. However, its presence is not needed to convey either phonemic information or prosody in speech. (Prosody refers to the rhythm and the pitch pattern: prosody is the 'melody' of speech. Experiment: record a sentence. Listen to it and estimate the pitch range. The look at its spectrogram and observe the range of fundamental frequencies.) The pass band of hard-wire telephones is typically about 300 to 4000 Hz, so the fundamental is usually absent or much attenuated. The loss of information carried by frequencies above 4000 Hz (e.g. the confusion of ‘f’ and ‘s’ when spelling a name) is noticed in telephone conversation, but the loss of low frequencies is much less important. (Experiment: next time you are put ‘on hold’ on the telephone, listen to the bass instruments in the music. Their fundamental frequencies are not carried by the telephone line. Can you hear their pitch? Of course, they are less 'bassy' than if you heard them live, but is the pitch any different? Then see the remark about pitch in the preceding paragraph.)
Our hearing is most sensitive for frequencies from 1000 to 4000 Hz. Consequently, the fundamentals of low voices, especially low men's voices, contribute little to their loudness, which depends more on the power carried by harmonics that fall near resonances and especially those that fall in the range of high aural sensitivity. (Another Experiments: (i) make spectrograms of your own voice. (ii) you can test your own hearing sensitivity on this site.)
Timbre and singing
Varying the spectral envelope of the voice is part of the training for many singers. They may wish to enhance the energy in some frequency ranges, either to produce a desired sound, to produce a high sound level without a high energy input, or to produce different qualities of voice for different effects. Characteristic spectral peaks or tract resonances have been studied in different singing styles and techniques (Stone et al., 2003; Sundberg et al., 1993; Bloothooft and Pomp, 1986a; Hertegard et al., 1990; Steinhauer et al., 1992; Ekholm et al., 1998; Titze, 2001; Vurma and Ross, 2002; Titze et al., 2003; Bjorkner, 2006; Garnier et al., 2007b; Henrich et al., 2007). In this laboratory, we have been especially interested in three techniques: resonance tuning, harmonic singing and the singers formant.
The origin of vocal tract resonances
Vocal tract resonances (Ri) give rise to peaks in the output spectrum (Fi). However, the relation between Ri and Fi is a little subtle. For that reason, let’s consider the behaviour of some geometrically simple systems, for which acoustical properties can be more easily calculated. This is illustrated in the cartoons here and below. (This section follows Wolfe et al, 2009.)
In the top sketch, we have imagined ‘straightening out’ the vocal tract. Below, it is modelled as a simple cylindrical pipe to explain, only qualitatively, the origin of the first two resonances. Below we give theoretical calculations for the input impedance spectrum and a transfer function for simplistic models of the vocal tract with length L = 170 mm and (constant) radius = 15 mm. The dashed line in the graph is for a cylinder. (And for a simple closed-open cylinder, the first resonance is at f = c/λ = c/4L, where c is the speed of sound. Taking L = 170 mm gives R1 = 500 Hz. See this link.) When a circular ‘glottal’ constriction is added, with a radius of 2 mm and an effective length of 3 mm (including end effects), the result is the solid line in the graph below. This graph of impedance at the glottis as a function of frequency is taken from Wolfe et al (2009). Below it is a gain or transfer function: in this case the ratio of presure at the lips to that at the glottis. (Usually we think of the frequency as being that of the fundamental, but it can be useful to discuss the behaviour of harmonics, too.)
At this stage, it is helpful to introduce the acoustic impedance, Z, which is the ratio of sound pressure p to the oscillating component of the flow, U at a particular location, usually the entry or exit of a duct. (This link gives an introduction to acoustic impedance.) Z is large if a large variation in pressure is required to move air, and conversely. So Z is large at the glottis at frequencies for which large acoustic pressures produces only a small acoustic flow. However, at these frequencies, Z is small at the mouth, where low acoustic pressure drives a relatively large acoustic air flow out of the mouth.
Z is a complex quantity, meaning that p and U are, in general, not in phase, so that Z has both a magnitude (shown in the plots at right) and a phase. The in-phase component (the real component when complex notation is used) represents conversion of sound energy into heat (or sound radiation). When the p and U are in phase, the impedance is resistive and the input energy in each cycle is lost, usually by radiation as sound and (typically to a greater extent) by viscous and thermal losses between the wave and the duct. Components that are 90° out of phase (imaginary components in complex notation) represent storage of energy, rather than loss. A small mass of moving air in a sound wave stores kinetic energy but, because of its inertia, pressure is required to accelerate it. It has an inertive impedance (p is 90° ahead of U, positive imaginary component). Flow of air into a small confined space increases the pressure, storing potential energy in the 'springiness' of the air. This is compliant impedance (p is 90° behind U, negative imaginary component).
When the dimensions of a duct are not negligible in comparison with the wavelength, p and U vary along its length. Z often varies strongly with frequency and the phase changes sign at each resonance. The plot at right shows the calculated impedance at the glottis, which we might write as ZG.
(The resonances are not purely acoustic: because the surrounding tissues are not rigid, their mechanical properties are involved, especially at low frequencies (Hanna et al., 2016).)
Tract-wave interactions
At a mouth that is open to the outside world, the sound wave is not completely ‘free’ to escape, and it doesn't have zero pressure, because of Zrad, the impedance of the radiation field outside the mouth. A pressure p at the lips is required to accelerate a small mass of air just outside the mouth: its inertance is not zero, but is usually Zrad small. At high frequency, however, larger accelerations are required for any given amplitude (acceleration is proportional to amplitude times frequency squared, see this link), so Zrad increases with frequency. In a confined space (inside the vocal tract), acoustic flow does not spread out, so impedances are usually rather higher than Zrad.
As we explain in this link, Z in a pipe (or in the vocal tract) depends strongly on reflections that occur at open or closed ends. A strong reflection occurs at the lips, going from generally high Z inside to low Z in the radiation field. Suppose that a pulse of high-pressure air is emitted from the glottis just when a high pressure burst pulse returns from a previous reflection: the pressures add and Z is high. Conversely, if a reflected pulse of suction cancels the input pressure excess, Z is small. This effect produces the large range of Z shown in the previous graph.
For the sake of simplicity, let’s imagine the tract as a simple cylindrical tube of length 170 mm, nearly closed at the glottis but open at the mouth. In fact, for /3/ (the vowel in the word "heard"), the resonances shown in the figure above fall at the frequencies expected for such a tube. The wavelengths that give maxima in Z are approximately λ1 = 4L, λ3 = 4L/3, λ5 = 4L/5, etc and so the frequencies of maxima are f1 = c/4L, f3 = 3c/4L = 3f1, f5 = 5c/4L = 5f1, etc. These maxima correspond closely to the resonant modes of a closed-open pipe. For the simple pipe, minima occur half way between the maxima: see the graph above. (Caution: in this unrealistic example, the resonances are harmonically related. That is not the case for a real vocal tract, except coincidentally and roughly for the vowel /3/.)
Now let’s add the glottis, giving a local constriction at the input. The solid line shows the new input impedance Z. The maxima in Z (pressure antinodes or flow nodes) are hardly changed. This makes sense: a local constriction (of small volume) at the input has little effect on a maximum in Z, where flow is small. For modes where the flow is large, however, the air in the glottis must be accelerated by pressures acting on only a small area. So the frequencies of the minima in Z (pressure node, flow antinode) occur at lower frequencies. If the glottis is sufficiently small, Z(f) falls abruptly from each maximum to the next minimum, which thus occur at similar frequencies. So do the maxima in the transfer functions. This has the consequence for ZG that the range of inertive impedance (approximately from minimum up to next maximum above) is larger than the range of compliant impedance (from maximum up to next minimum), so the acoustic load is expected to be more often inertive than compliant.
So far, we haven’t mentioned the impedance of the subglottal tract leading to the lungs. This is difficult to measure. The lungs have complicated geometry, with successively branching tubes, extending to quite small scale at the alveoli. This branching behaves acoustically a little like the expanding cross section in the bell of a brass instrument, and so gives reflections. For acoustic frequencies, it behaves very roughly like a tube open at the lung end and with an effective length of less than about 20 cm (Ishizaka et al., 1976; Lulich et al., 2010; Hanna et al., 2018). Its possible influence on the vocal folds is subtle and difficult to study.
Source-filter interactions: Do the ‘source’ and the ‘filter’ affect each other?
As we explained above, the resonances of the vocal tract occur at frequencies well above those of the fundamental frequency – at least for normal speech and low singing. Further, the frequencies of vocal fold vibration (which gives the voice its pitch) and those of the tract resonances (which determine the timbre and, as we have seen, the phonemes) are controlled in ways that are often nearly independent. In most singing styles, the words and melody of a song are prescribed. Conversely, in speech, we have the subjective impression that we can vary the prosody independently of the phoneme – for example, one can usually replace a key word in a sentence without changing the prosody at all. (Experiment: Record your normal voice saying 'This is a cat' and 'This is a dog'. Does the prosody vary?)
As mentioned above, the voice is unlike a trombone or other wind instrument*, in which one of the resonances of the air column drives the player's lips or reed (respectively) at a frequency close to its resonant frequency. In the voice, there is usually no simple relation between the frequencies: a singer may cover a range of two or more octaves (i.e. vary the frequency by a factor of 4 or more) with relatively little change in the shape and size of the vocal tract. Further, although there is typically a difference of an octave (a factor of two in wavelength) between the fundamental frequencies of male and female singing voices, the ratio of the lengths of their tracts is much less than two.
From this we can conclude that the resonances of the tract do not normally control the pitch frequency of the voice. Nevertheless, the glottal source and the vocal tract resonances may be interrelated in a number of ways. First, there are direct, physical interactions: the type of vibration of the vocal folds can affect the reflections of sound waves at the glottis, and so affects standing waves in the tract (cf. the figure above). These could affect vocal fold motion. Second, pressure waves in the tract can influence the air flow through the glottis or the motion of the vocal folds. Third, there is the possibility that speakers and singers may consciously or unconsciously use combinations of fundamental frequency and resonance frequency for different effects, in particular to achieve more sound output with lower power input. We discuss these in turn.
* Is there an acoustic instrument like the voice? Not really, but one can mention some functional similarities with the harmonica or mouth organ. In that instrument, the pitch is largely determined by mechanical properties of a metal reed that controls the air flow. The pitch may, however be affected by effects in the acoustic field nearby, e.g. cupping the hands over the instrument to ‘bend’ tones. Like the voice, the harmonica may produce sounds whose wavelengths are much larger than the size of the instrument and, like the voice, one can modify the spectral envelope by changing the geometry of the air space throuh which it radiates, with clear changes in timbre. The trombone offers both contrasts and similarities that are more instructive; see our paper What might the trombone teach us about the singing voice - a tutorial review.
Does the glottis affect the tract resonances?
The glottis is very much smaller than the cross-section of the vocal tract, which is why, in the simplistic figure above, we treated the vocal tract as a pipe open at mouth and closed at glottis. This is an exaggeration, of course! The average opening of the glottis depends on what fraction of the time it is open (its ‘open quotient’) and how far it opens (Klatt and Klatt, 1990; Alku and Vilkman, 1996; Gauffin and Sundberg, 1989). These depend in turn on the voice register and pitch. See
The source at the larynx above.
For a duct that is almost closed at one end and open at the other, the frequency of the first resonance increases as the smaller opening increases. Various researchers have shown that, when the glottis is somewhat open for whispering, the resonance or formant peaks occur at higher frequencies (Kallail and Emanuel, 1984a,b; Matsuda and Kasuya, 1999; Itoh et al., 2002; Barney et al, 2007; Swerdlin et al., 2010).
Do pressure waves affect the vocal fold vibration?
This is an area in which it’s hard to do the experiments that would most clearly answer the question. However, there has been a lot of work on numerical models. Some of these predict that air through the glottis and the vocal fold vibrations depend on the pressure difference across the glottis and folds, and thus waves in the tract (Rothenberg, 1981; Titze, 1988, 2004). Not surprisingly, the phase of the pressure wave is important in these models. (For a simple example, whether a pressure decrease outside the vocal folds will tend to open them will depend on when during a cycle it arrives.)
Can one observe the effect of pressure waves on the motion of vocal folds experimentally? Hertegard et al., (2003) used an endoscope (a camera looking down the throat) to film the larynx while singers mimed singing, and a tube sealed at the lips provided artificial pressure waves. They reported bigger vibrations in the vocal folds when the pressure waves had frequencies near those of normal singing. In our lab (Wolfe and Smith, 2008), we used electroglottography (EGG, described above) to monitor the vocal fold vibration, and used a didjeridu (the indigneous Australian musical instrument) to produce the pressure waves. We found that the didjeridu signal could drive the folds at a level comparable with those generated by singing. All the above evidence suggests that the standing waves in the ‘filter’ can, in some cases, have a strong interaction with the source.
Vocal resonance tuning by singers (and orators)
Recall that the resonances R1, R2 etc are properties of a particular vocal tract geometry, whatever the note. Their values are not harmonically related to each other and they are specified (or at least suggested) by the lyricist. If s/he has written 'head', then s/he's suggesting that you produce formants F1 and F2 with values of roughly 500 Hz and 1800 Hz, (see the graphs in Vowels, above) and, in normal speech, you'd adjust your tongue shape and lip aperture to produce R1 and R2 close to these values. The harmonics of the note (fo, 2fo, 3fo etc) are specified, rather more precisely, by the composer. If s/he has written that note as A4, then your harmonics should be, with an accuracy of a percent or better, 440 Hz, 880 Hz etc.
However, if you want to sing or to to speak loudly, you might want to take advantage of the resonances of the vocal tract to produce a louder sound for less effort (i.e. to improve the efficiency with which energy is transmitted from the glottis to the outside sound field).
Adjusting the Ri for as a function of the sung fo is called resonance tuning. Ajusting the fo and Ri of a spoken vowel to match each other is also called resonance tuning, whichever or both is adjusted.
The most studied example concerns the problem faced by sopranos. The range of R1 (about 300 to 800 Hz, roughly D4 to G5) overlaps approximately the range of the soprano voice. If a soprano did no resonance tuning, she’d have a serious problem: First, for many note-vowel combinations, the fo of the note would fall above R1, so the acoustic gain from R1 would be lost. This would be an important loss, especially for operatic sopranos, who compete with an orchestra, without the aid of a microphone.
Sundberg and colleagues pointed out that classically trained sopranos learn to increase the mouth opening as they ascend the scale (Lindblom and Sundberg, 1971, Sundberg and Skoog, 1997) and measured this opening as a function of pitch. Increased mouth opening raises R1, so Sundberg and colleagues deduced that sopranos were tuning R1 to a value near fo.
Our experiments, using acoustic excitation at the mouth to measure the resonances, confirmed this (Joliveau et al., 2004a,b). When fo was low enough, sopranos used typical values of R1 and R2 for each vowel. However, when fo was equal to or greater than the usual value of R1, they increased R1 so that it was close to fo. For vowels with low R1, this tuning of R1 to fostarts at lower pitch, and it continues almost up to 1 kHz. Here is a web page about this research, including some sound files. ( Experiment: if you have a high voice, try reproducing some of the recordings on that page. Also try to see whether you can sing the high range without resonance tuning. Is it difficult?)
How do they learn to do this? We think that they respond, probably subconsciously, when the sound is louder for a given effort. It may also be that vocal fold vibrations are easier to produce when the resonance is tuned close to the frequency of the fundamental. Either way, all sopranos, even those with no formal training, performed this tuning when singing scales in our lab.
What about vocal resonance tuning for lower voices? In much of the alto range, and for some vowels in the high range of men’s voices, the same problem arises and, although it is much less studied, similar effects are occasionally, but not universally observed (Henrich et al, 2011). Further, some singers (including altos who belt and Bulgarian folk singers) seem to tune R1 to the second harmonic (i.e. to 2fo) over a limited range (Smith et al., 2007).
Finally, it is worth noting that it is difficult to tune R1 much above 1 kHz, in part because it is hard to open one's mouth wide enough. Some sopranos who practise the very range of the coloratura soprano, or the whistle voice in pop music, tune R2 to fo, above about C6, which gives them up to another octave or so in their whistle or M3 mechanism (Garnier et al, 2011).
This figure, from Kob et al (2011), shows the different tuning strategies that may be used by different voice categories. Oversimplifying for the sake of brevity, low voices may tune R1 (or R2) to harmonics of the voice. Altos, especially in belting and in the Bulgarian style, tune R1 to the second harmonic (Henrich et al., 2007). Sopranos tune R1 to fo up to high C and above that tune R2 to fo. Men sometimes tune R1 to harmonics of the voice, especially 2fo, 3fo and 4fo. See Henrich et al (2011) for details. ( Experiment: make a spectrogram of an important note in a recording of a tenor or baritone and see if you can see an unexpectedly prominent harmonic. Can you hear that harmonic separately?)
Harmonic singing
In a range of styles known as harmonic or overtone singing, practitioners use a constant, rather low fundamental frequency, in a range where the ear is not very sensitive to the fundamental fo. They then tune a resonance to select one of the high harmonics, typically from about the fifth (5fo) to the twelfth (Kob, 2003; Smith et al., 2007). The gain from the resonance makes that harmonic 'stand out' like a separate note. The effect is enhanced when the melody moves from one harmonic to another: we naturally concentrate on the moving note, rather than the steady drone (more about this technique here).
Is resonance tuning used in speech?
Some speakers (actors, public speakers, teachers) have to speak long and loudly. Resonance tuning might be easier for them in one sense: unlike (most) singers, they get to choose the pitch for every word. Some preliminary research suggests that resonance tuning is used in shouting.
The singers formant
Male, classically-trained singers often show a spectral peak in the range 2–4 kHz, a range where the ear is quite sensitive. This spectral peak is called the singers formant (Sundberg, 1974, 2001; Bloothooft and Plomp, 1986b). This vocal feature has the further advantage that orchestras have relatively little power in this range, which might allow opera soloists to ‘project’, i.e. to be heard above a large orchestra in a large opera hall.
Sundberg (1974) attributes the singers formant to a clustering of the third, fourth and/or fifth resonances of the tract. Singers produce this formant by lowering the larynx and narrowing the vocal tract just above the glottis (Sundberg, 1974; Imagawa et al., 1003; Dang and Honda, 1997; Takemoto et al., 2006). A vocal tract with this geometry should work better to transmit power from the glottis to the sound field outside the mouth. (To continue the simple, 1D models: the constricted supragottal region could approximate a quarter wave resonator at ~ 3 kHz and act as an impedance matcher between glottis and the main vocal tract.)
When a strong singers formant is combined with the strong high harmonics produced by rapid closure of the glottis, the effect is a very considerable enhancement of output sound in the range 2-4 kHz – i.e. in a range in which human hearing is very acute and in which orchestras radiate relatively little power. It is not surprising that these are among the techniques used by some types of professional singers who perform without microphones.
Increasing the fraction of power at high frequencies has a further advantage: at wavelengths long in comparison with the size of the mouth, the voice radiates almost isotropically. As the frequency rises and the wavelength decreases, the voice becomes more directional, and proportionally more of the power is radiated in the direction in which the singer faces, which is usually towards the audience (Flanagan 1960; Katz and d’Alessandro, 2007, Kob and Jers, 1999). So increasing the power at high rather than low frequencies via rapid glottal closure and/or a singer’s formant help the singer not to ‘waste’ sound energy radiated up, down, behind and to the sides.
Singers formants are either weaker, not usually observed, or harder to demonstrate, in women singers (Weiss et al., 2001). This is not surprising: high voices have wide harmonic spacing, which makes it hard to define a formant in the spectrum of any single note. Further, a resonance configuration that would produce a singers formant is of less use to a high alto or soprano, because the wide spacing between harmonics allows that high resonance to fall between adjacent voice harmonics (e.g. 2fo < R3 < 3fo). (The typical width of the singers formant is a few-several hundred Hz.) High voices also have the advantage that the fundamental, usually the strongest harmonic, falls in the range of sensitive human hearing. Finally, high voices can use tuning of the low resonances (R1 and sometimes R2) more effectively than other singers. So, because of their high pitch range and R1:fo tuning, high voices have less need of and few possibilities to use a singers formant.
A number of studies have investigated a speaker’s formant or speaker’s ring in the voice of theatre actors or in the speaking voice of singers (Pinczower and Oates, 2005; Bele, 2006; Cleveland et al., 2001; Barrichelo et al., 2001; Nawka et al., 1997). Leino (1993) observed a spectrum enhancement in the voices of actors, but of smaller amplitude than the singers formant, and shifted about 1kHz towards high frequencies. This was interpreted as the clustering of F4 and F5. Bele (2006) reported a lowering of F4 in the speech of professional actors, which contributed to the clustering of F3 and F4 in an important peak. Garnier (2007) also reported such a speaker's formant in speech produced in noisy environment, with a formant clustering that depended on the vowel.
Adachi, S., & Yu, J. (2005). Two-dimensional model of vocal fold vibration for sound synthesis of voice and soprano singing. Journal of the Acoustical Society of America. 117, 3213–3224.
Alku, P., (1991). "Glottal Wave Analysis With Pitch Synchronous Iterative Adaptive Inverse Filtering", in Proc. Second European Conf on Speech Communication and Technology, Genova, Italy.
Barrichelo, V. M. O., Heuer, R. J., Dean, C. M. & Sataloff, R. T. (2001)”Comparison of singer's formant, speaker's ring, and LTA spectrum among classical singers and untrained normal speakers”, J. Voice, 15, 344-350.
Baken, R.J. and Orlikoff, R.F. (2000). Clinical Measurement of Speech and Voice. 2nd ed. Singular Publishing Group, San Diego, California.
Barney, A., De Stefano, A., and Henrich, N. (2007). “The effect of glottal opening on the acoustic response of the vocal tract” Acta Acustica united with Acustica, 93, 1046-1056.
Behnke E. (1880). The mechanism of the human voice, 12th ed. London: J. Curwen & Sons, Warwick Lane, E.C.
Bele, I. (2006) "The speaker's formant". J. Voice, 20, 555-578.
Bjorkner, E. (2006). Why so different? Doctoral dissertation. KTH, Stockholm.
Bloothooft, G. and Plomp, R. 1986a. “Spectral analysis of sung vowels. III. Characteristics of singers and modes of singing.” J. Acoust. Soc. Am. 79, 852-864.
Bloothooft, G. and Plomp, R. (1986b). The sound level of the singer's formant in professional singing. J.Acoust.Soc.Am., 79, 2028-2033.
Boutin, H., Smith J. and Wolfe, J. (2015) "Laryngeal flow: how large is the component due to vertical motion of the vocal folds during the closed glottis phase?" J. Acoust. Soc. America, 138, 146-149.
Carlson, R., Granström, B. and Fant, G. (1970). "Some studies concerning perception of isolated vowels." STL-QPSR 2-3: 19-35.
Chen, M.Y. (1997). “Acoustic correlates of English and French nasalized vowels”. J. Acoust. Soc. Am. 102, 2360-2370.
Childers, D.G., Krishnamurthy A.K., (1985). "A critical review of electroglottography". Critical rev. biomed.l eng., 12, 131-161.
Childers, D. G. & Lee, C. K. (1991). “Vocal quality factors: analysis, synthesis, and perception”. J.Acoust.Soc.Am., 90, 2394-2410.
Clark, J. Yallop, C. and Fletcher, J., An Introduction to Phonetics and Phonology, Blackwell, Oxford (2007).
Cleveland, T. F., Sundberg, J. and Stone, R. E. (2001). “Long-term-average spectrum characteristics of country singers during speaking and singing.” J. Voice, 15, 54-60.
Dang, J. and Honda, K., (1997). "Acoustic characteristics of the piriform fossa in models and humans", J.Acoust.Soc.Am., 101: 456-465.
Ekholm, E., Papagiannis, G. C. and Chagnon, F. P. 1998. Relating objective measurements to expert evaluation of voice quality in western classical singing: Critical perceptual parameters. J. Voice 12, 182-196.
Elliot, S.J., Bowsher, J.M. (1982). "Regeneration in brass wind instruments", J. Sound & Vibration 83, 181-217.
Fant, G. (1960). Acoustic Theory of Speech Production. Mouton & Co, The Hague, Netherlands.
Feng, G. and Castelli, E. 1996. Some acoustic features of nasal and nasalized vowels: A target for vowel nasalization. J. Acoust. Soc. Am., 99, 3694-3706.
Flanagan, J. and Landgraf, L. (1968). "Self-oscillating source for vocal-tract synthesizers", IEEE Trans. Audio and Eletroacoustics, 16, 57-64.
Flanagan, J. L. (1960). Analog Measurements of Sound Radiation from the Mouth. J.Acoust.Soc.Am., 32, 1613-1620.
George, N. A., de Mul, F. F. M., Qiu, Q., Rakhorst, G., and Schutte, H. K.
(2008). “Depth-kymography: high-speed calibrated 3D imaging of human
vocal fold vibration dynamics,” Phys. Med. Biol. 53, 2667–2675.
Garcia M. (1855). Observations on the human voice. In: Proc. Royal Soc. London, p. 399-410.
Garnier, M. (2007). Communication in noisy environments: from adaptation to vocal straining. Ph.D thesis, University of Paris 6.
Garnier, M., Henrich, N., Castellengo, M., Sotiropoulos, D. and Dubois, D. (2007). "Characterisation of Voice Quality in Western Lyrical Singing: from Teachers's Judgements to Acoustic Descriptions". J. Interdisciplinary Music Studies 1(2): 62-91.
Garnier, M., Wolfe, J., Henrich, N. and Smith, J. (2008). "Interrelationship between vocal effort and vocal tract acoustics: a pilot study". Proc. of ICSLP, Brisbane, Australia.
Gauffin, J. and Sundberg, J. (1989). "Spectral correlates of glottal voice source waveform characteristics." J. Speech and Hearing Research 32(3): 556-565.
Henrich, N. (2006). "Mirroring the voice from Garcia to the present day: some insights into singing voice registers." Logopedics Phoniatrics Vocology 31(1): 3-14.
Henrich, N., d'Alessandro, C., Doval, B. and Castellengo, M. (2005). "Glottal open quotient in singing: Measurements and correlation with laryngeal mechanisms, vocal intensity, and fundamental frequency." J.Acoust.Soc.Am. 117: 1417-1430.
Hertegard, S., Gauffin, J., Sundberg, J. 1990. “Open and covered singing as studied by means of fiberoptics, inverse filtering and spectral analysis”. J. Voice, 4, 220-230.
Hirano M, Vennard W, Ohala J. (1970). "Regulation of register, pitch and intensity of voice". Folia Phoniatrica, /22, 1-20.
Hollien, H. and Michel, J. F. (1968). "Vocal fry as a phonational register." J. Speech Hearing Research 11(3): 600-604.
Itoh, T., Takeda, K. and Itakura, F. (2002) "Acoustic analysis and recognition of whispered speech", in Proceedings of ICASSP, vol.1, 389-392.
Imagawa, H., Sakakibara, K.-I., Tayama, N. (2003). "The effect of the hypopharyngeal and supra-glottic shapes on the singing voice", in Proceedings of SMAC, Stockholm, Sweden.
Ishizaka, K., Matsudaira, M., and Kaneko, T. (1976). “Input acoustic-impedance measurement of the subglottal system,” J. Acoust. Soc. Am. 60, 190–197.
Joliveau, E., Smith, J. and Wolfe, J. (2004) "Vocal tract resonances in singing: the soprano voice", J. Acoust. Soc. America, 116, 2434-2439. Copyright (2004) Acoustical Society of America. This article may be downloaded for personal use only. Any other use requires prior permission of the author and the Acoustical Society of America. The preceeding article appeared in (JASA116, 2434-2439) and may be found at (J. Acoust. Soc. America,).
Johnson, K. (2003). Acoustic and Auditory Phonetics. 2nd ed.Blackwell, Oxford.
Kallail, K. J., and Emanuel, F. W. (1984a). "Formant–frequency differences between isolated whispered and phonated vowel samples produced by adult female subjects", J. Speech Hear. Res. 27, 245–251.
Kallail, K. J., and Emanuel, F. W. (1984b). "An acoustic comparison of isolated whispered and phonated vowel samples produced by adult male subjects", J. Phonetics 12, 175-186.
Katz, B. & D'Alessandro, C. (2007). Measurement of 3D Phoneme-Specific Radiation Patterns in Speech and Singing, LIMSI. http://rs2007.limsi.fr/index.php/PS:Page_14
Kitamura, T., Honda, K. and Takemoto, H., (2005). "Individual variation of the hypopharyngeal cavities and its acoustic effects", Acoustic Science and Technology, 26(1): 16-26.
Klatt, D. H. and Klatt, L. C. (1990) "Analysis, synthesis, and perception of voice quality variations among female and male talkers",J.Acoust.Soc.Am., 87, 820-857.
Kob, M. & Jers, H. (1999). Directivity measurement of a singer. J.Acoust.Soc.Am., 105, 1003.
Kob, M. (2003) “Analysis and modelling of overtone singing in the sygyt style” Appl. Acoust., 65, 1249-1259.
Leino, T. (1993). Long-term average spectrum study on speaking voice quality in male actors. Proceedings of SMAC, Stockholm, Sweden, 206-210.
Lieberman, P., and Blumstein, S.E. (1988). "Speech physiology, speech perception, and acoustic phonetics." Cambridge University Press, Cambridge, UK.
Lindblom, B. E. F., and Sundberg, J. E. F. (1971). “Acoustical consequences of lip, tongue, jaw, and larynx movement,” J. Acoust. Soc. Am. 50, 1166-1179.
Lulich, S.M., Alwan, A., Arsikere, H., Morton, J.R., Sommers, M.S., (2011). “Resonances and wave propagation velocity in the subglottal airways,” J. Acoust. Soc. Am. 130, 2108–2115.
Matsuda, M. and Kasuya, H., (1999)"Acoustic nature of the whisper", in Proceedings of Eurospeech'99, 133-136.
Miller, R.L. (1959). "Nature of the Vocal Cord Wave". J.Acoust.Soc.Am., 31, 6, 667-677.
Miller, D.G. and Schutte, H.K. (1993). "Physical definition of the ‘flageolet register’". J. Voice, 7, 3, 206-212.
Miller DG. (2000). Registers in singing: empirical and systematic studies in the theory of the singing voice. Doctoral dissertation, University of Groningen.
Nawka, T., Anders, L. C., Cebulla, M. & Zurakowski, D. (1997). “The speaker's formant in male voices”, J. Voice, 11, 422-428.
Nearey, T. (1989). "Static, dynamic, and relational properties in vowel perception.". J.Acoust.Soc.Am.. 85, pp. 2088-2113.
Novak, A. and Vokral, J. (1995). "Acoustic parameters for the evaluation of voice of future voice professionals." Folia Phoniatrica Logopedica 47: 279-285.
Petersen, G.E., and Barney, H.L., ‘Control methods used in a study of vowels’, J. Acoust. Soc. Am. 24, 175-184 (1952).
Pinczower, R., Oates, J. (2005) “Vocal Projection in Actors: The Long-Term Average Spectral Features That Distinguish Comfortable Acting Voice From Voicing With Maximal Projection in Male Actors”, J. Voice 19, 440-453.
Rothenberg, M. “An interactive model for the voice source” Quarterly Prog. Status Report, Dept Speech, Music and Hearing, KTH, Stockholm, 22. 1-17 (1981).
Rothenberg, M. (1973). "A new inverse-filtering technique for deriving the glottal air flow waveform during voicing". J.Acoust.Soc.Am., 53, 6, 1632-1645.
Roubeau B, Castellengo M, Bodin P, Ragot M. (2004). "Laryngeal registers as shown in the voice range profile". Folia Phoniatrica Logopaedica, 56, 5, 321-33.
Scherer, R.C. (1991). "Physiology of phonation: A review of basic mechanics". Phonosurgery: Assessment and surgical management of voice. 77-93.
Smith J., Henrich N., Wolfe J. (2007) “ Resonance tuning in singing”, 19th International Congress on Acoustics, Madrid, Spain, Sept. 2007.
Smits, R., ten Bosch, L., and Collier, R. (1996). "Evaluation of various sets of acoustic cues for the perception of prevocalic stop consonants. I. Perception experiment".J.Acoust.Soc.Am., 100, 3852-3864.
Steinhauer, K.M., Rekart, D.M. and Keaten, J. (1992). “Nasality in modal speech and twang qualities: Physiologic, acoustic, and perceptual differences”, J.Acoust.Soc.Am., 92, p. 2340.
Stevens, K.N. (1999). Acoustic Phonetics. MIT Press, Cambridge, MA.
Stone, R., Cleveland, T., Sundberg, J., Prokop, J. (2003). “Aerodynamic and acoustical measures of speech, operatic, and broadway vocal styles in a professional female singer.” J. Voice, 17, 283-297.
Sundberg, J. (1974) “Articulatory interpretation of the ‘singing formant’,” J.Acoust.Soc.Am. 55, 838-844.
Sundberg, J., Gramming, P. and Lovetri, J. (1993) “Comparisons of pharynx, source, formant, and pressure characteristics in operatic and musical theatre singing”, J. Voice, 7, 301-310.
Sundberg, J. (2001), ‘Level and centre frequency of the singer’s formant’, J. Voice 15, 176-186.
Sundberg, J., and Skoog, J. (1997) “Dependence of jaw opening on pitch and vowel in singers,” J. Voice 11, 301-306.
Sundberg, J. (1970). "Formant structure and articulation of spoken and sung vowels." Folia Phoniatrica (Basel) 22(1): 28-48.
Svec, J., Schutte, H.K. and Miller, D.G. (1999). "On pitch jumps between chest and falsetto registers in voice: Data from living and excised human larynges". The J.Acoust.Soc.Am., 106, 3, 1523-1531.
Svec, J., Schutte, H.K. (1996). "Videokymography: High-speed line scanning of vocal fold vibration". J. Voice, 10, 2 , 201-205.
Takemoto, H., Adachi, S., Kitamura, T., Mokhtari, P., Honda, K. (2006). "Acoustic roles of the laryngeal cavity in vocal tract resonance", J.Acoust.Soc.Am., 120: 2228-2238.
Titze, I.R. (1988) "The physics of small-amplitude oscillation of the vocal folds" J.Acoust.Soc.Am., 83, 1536-1552.
Titze, I. (1994) Priniciples of Voice Production.
Titze, I.R. (2001). “Acoustic Interpretation of Resonant Voice”, J. Voice 15, 519-528.
Titze, I.R., Bergan, C.C, Hunter, E.J. and Story, B. (2003). Source and filter adjustments affecting the perception of the vocal qualities twang and yawn. Logopedics Phoniatrics Vocology 28 : 47 – 155.
Van Den Berg, J. (1958). "Myoelastic-aerodynamic theory of voice production". The Journal of Speech Language and Hearing Research, 1, 3, 227-244.
Van Den Berg, J., Zantema, J.T., Doornenbal, P. Jr. (1957). “On the Air Resistance and the Bernoulli Effect of the Human Larynx”. J.Acoust.Soc.Am., 29, 5, 626-631.
Vurma, A., Ross, J. (2002). “Where Is a Singer's Voice if It Is Placed “Forward”?”, J. Voice, 16, 383-391.
van den Berg, J. W. (1958). Myoelastic-aerodynamic theory of voice production. J. Speech and Hearing Research, 1, 227–244a
The Sounds of World English: make a 'map' of your own accent and contribute to this global project.
is a multimedia introduction to voice science.
Examples of how acoustic measurements at the (open) lips can identify different vocal tract configurations.
The measured impedance ratios
γ(f) are at right. The particpant produces seven different gestures. The schematics on the left are cartoon 1D models of the tract (not to scale and highly simplified). Notice that, for inhalation (e), the vocal tract and trachea are connected, which roughly doubles the length of the former. This means roughly twice as many resonances in a given frequency range. Some of the same effect is seen, for low frequencies, in breathy phonation (d). (Figure from Jeanneteau et al (2020) above. That paper reports using measurements of the resonances as visual feedback to train singing in the very high soprano range.)


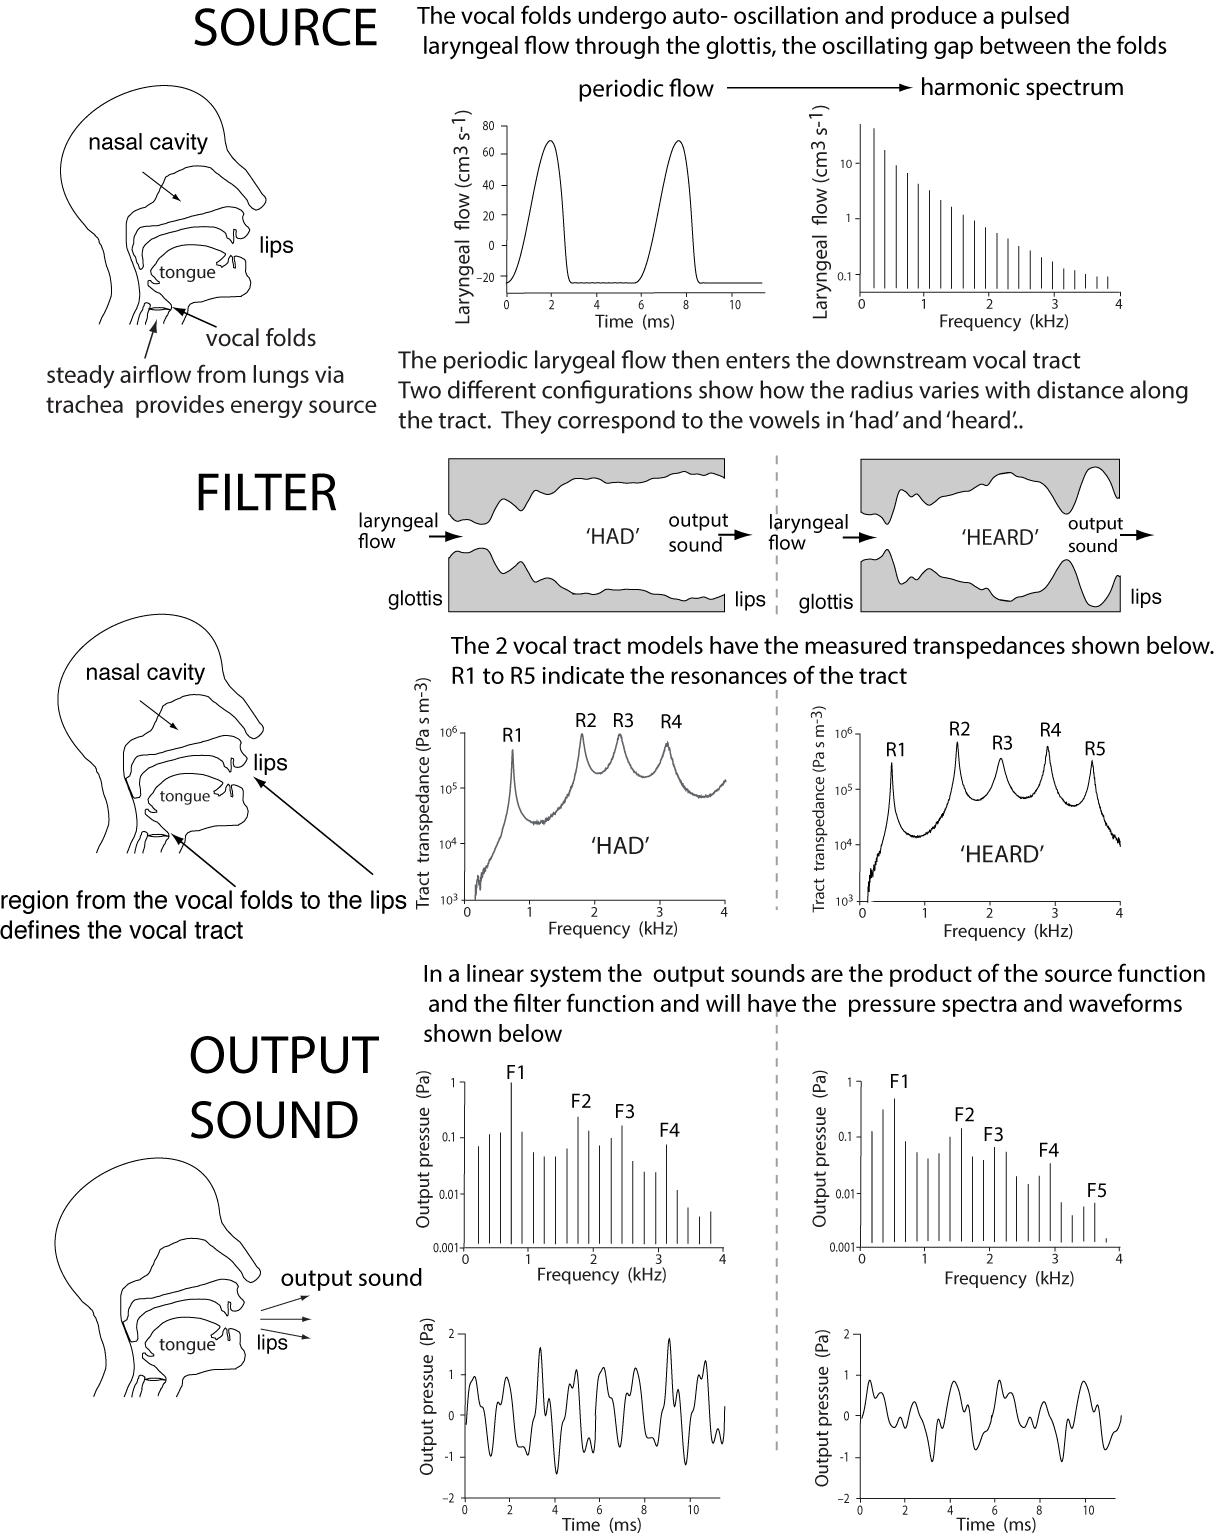
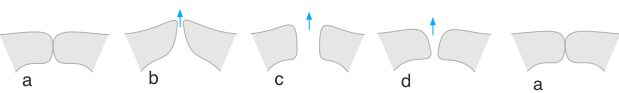
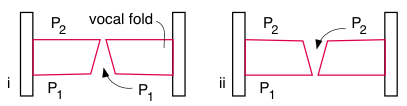
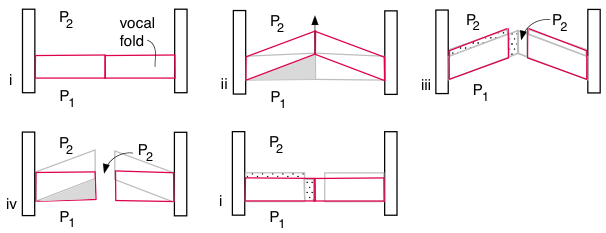
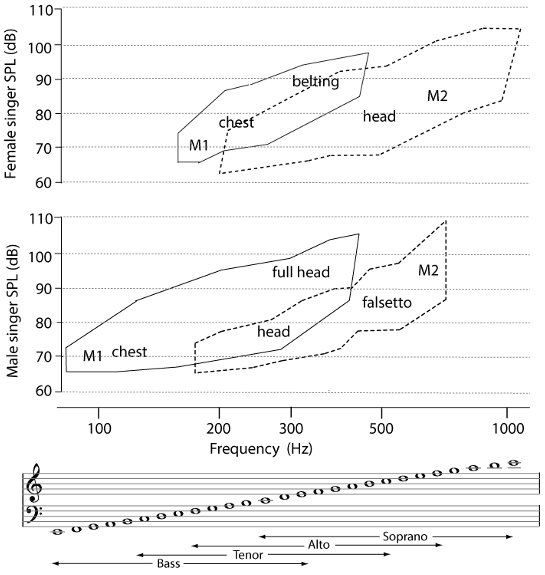
 At this stage, it is helpful to introduce the acoustic impedance, Z, which is the ratio of sound pressure p to the oscillating component of the flow, U at a particular location, usually the entry or exit of a duct.
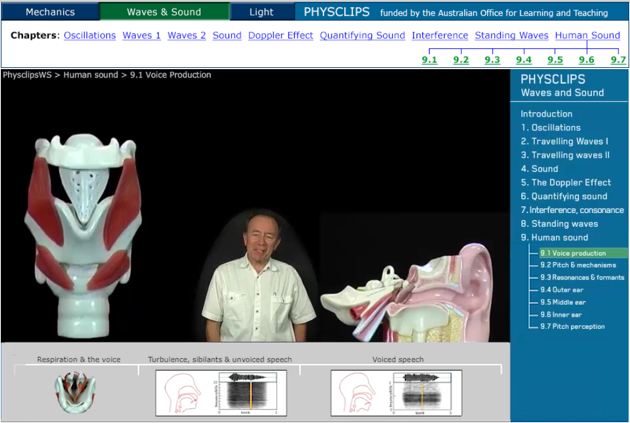
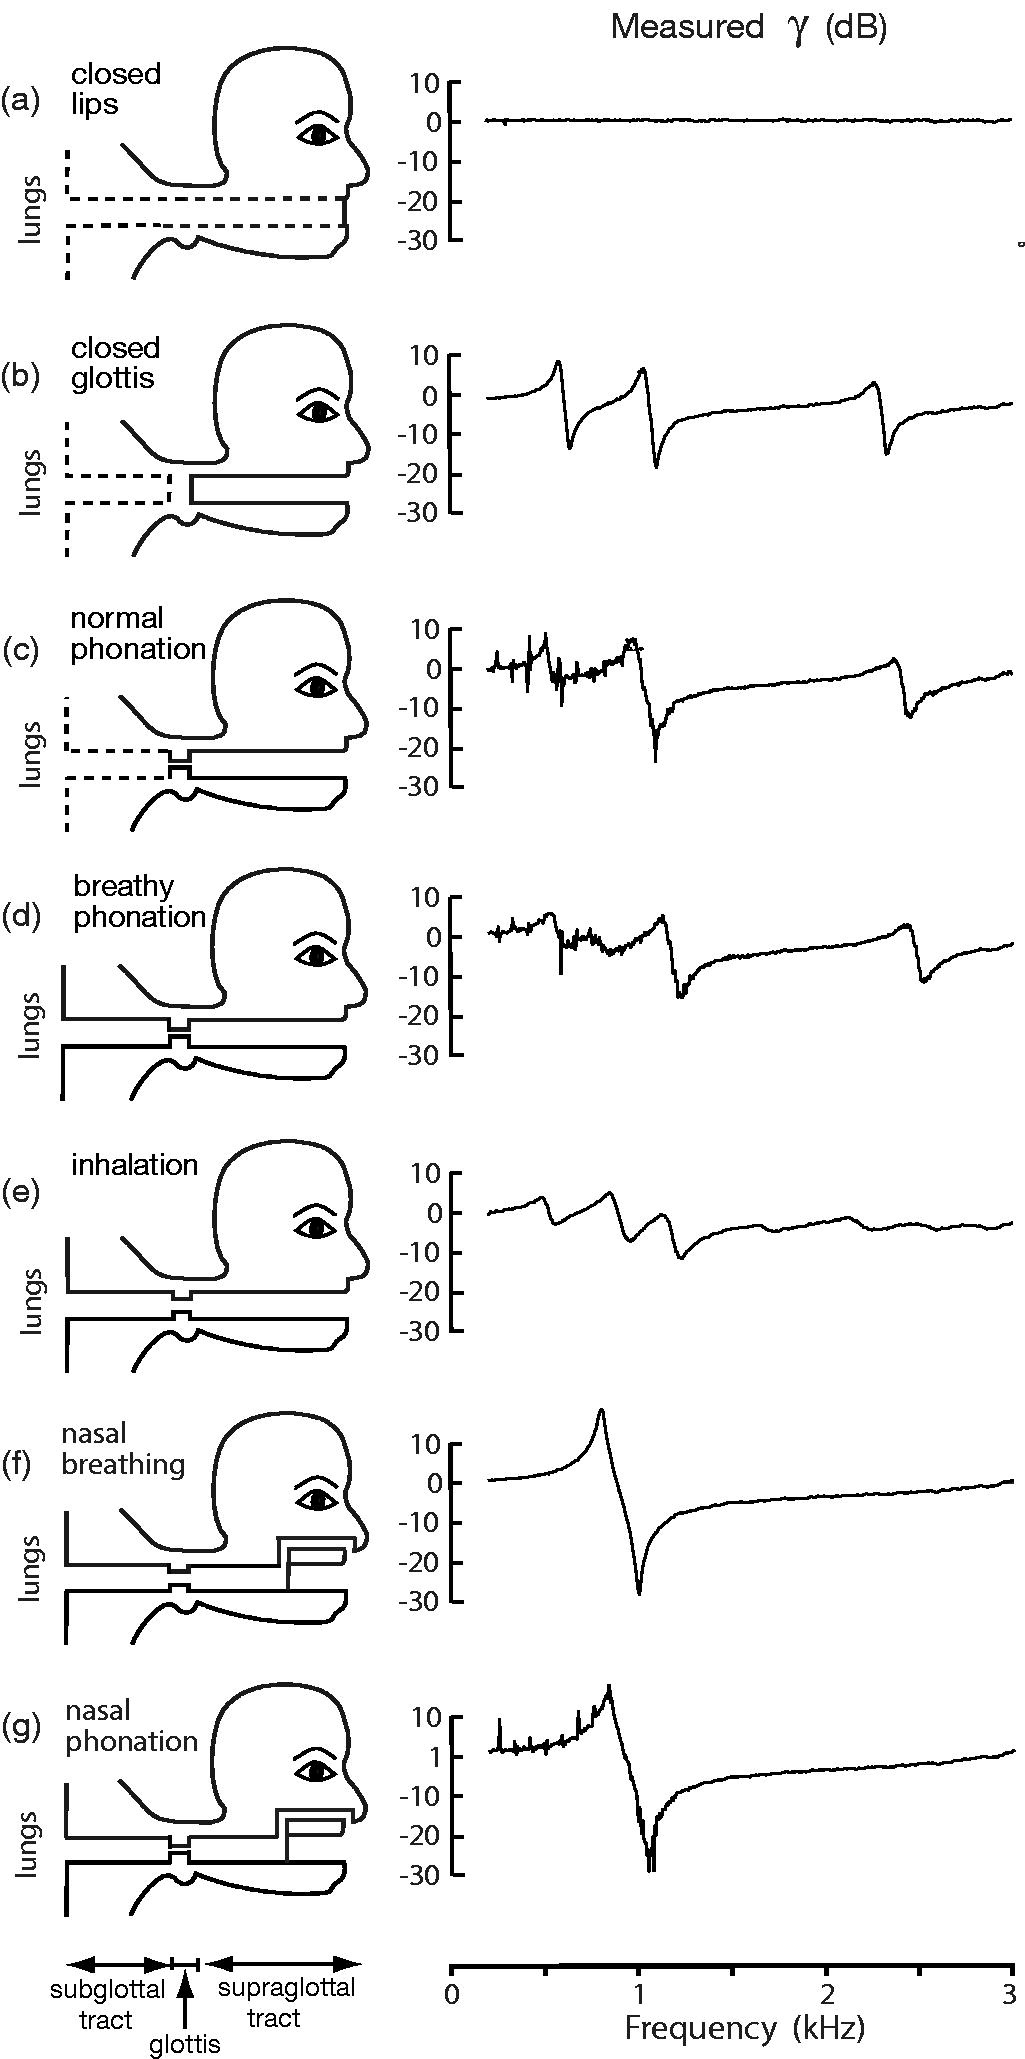
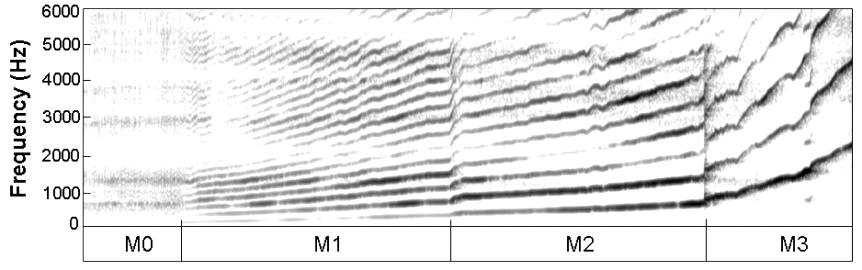