What is a Sound Spectrum?
A sound spectrum displays the different frequencies present in a sound.
Most sounds are made up of a complicated mixture of vibrations.
(There is an introduction to sound and vibrations in the document "How woodwind instruments work".)
Perhaps you can hear the sound of the
wind outside, the rumble of traffic - or perhaps you have some
music playing in the background, in which case there is a mixture
of high notes and low notes, and some sounds (such as drum beats
and cymbal crashes) which have no clear pitch.
A sound spectrum is a representation of a sound
– usually a short sample of a sound – in terms of the amount
of vibration at each individual frequency. It is usually presented
as a graph of either power or pressure as a function of frequency.
The power or pressure is usually measured in decibels
and the frequency is measured in vibrations per second (or
hertz, abbreviation Hz) or thousands of vibrations per second
(kilohertz, abbreviation kHz). You can think of the sound
spectrum as a sound recipe: take this amount of that frequency,
add this amount of that frequency etc until you have put together
the whole, complicated sound.
Today, sound spectra (the plural of spectrum is spectra) are usually
measured using
- a microphone which measures the sound pressure over a
certain time interval,
- an analogue-digital converter which converts this to a
series of numbers (representing the microphone voltage)
as a function of time, and
- a computer which performs a calculation upon these numbers.
Your computer probably has the hardware to do this already
(a sound card). Many software packages for sound analysis or sound editing have the software that can take a short sample of a sound recording, perform the calculation to obtain a spectrum (a digital fourier transform or DFT) and display
it in 'real time' (i.e. after a brief delay). If how have these, you can learn
a lot about spectra by singing sustained notes (or playing
notes on a musical instrument) into the microphone and looking
at their spectra. If you change the loudness, the size (or
amplitude) of the spectral components gets bigger. If you
change the pitch, the frequency of all of the components increases.
If you change a sound without changing its loudness or its
pitch then you are, by definition, changing its timbre.
(Timbre has a negative definition - it is the sum of all the
qualities that are different in two different sounds which
have the same pitch and the same loudness.) One of the things
that determines the timbre is the relative size of the different
spectral components. If you sing "ah" and "ee" at the same
pitch and loudness, you will notice that there is a big difference
between the spectra.
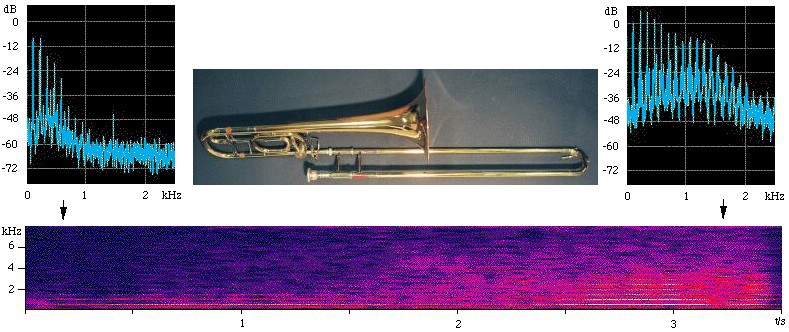
In this figure, the two upper figures are spectra, taken
over the first and last 0.3 seconds of the sound file. The
spectrogram (lower figure) shows time on the x axis, frequency
on the vertical axis, and sound level (on a decibel scale)
in false colour (blue is weak, red is strong). In the spectra,
observe the harmonics, which appear as equally spaced components
(vertical lines). In the spectrogram, the harmonics appear
as horizontal lines. In this example, the pitch doesn't change, so
the frequencies of the spectral lines are constant. However
the power of every harmonic increases with time, so the sound
becomes louder. The higher harmonics increase more than do
the lower, which makes the timbre 'brassier' or brighter,
and also makes it louder.
Spectra and harmonics
If you have tried looking at the spectrum of a musical note,
or if you have looked at any of the sound spectra on our web
pages then you will have noticed they have only a small
number of prominent components at a special set of frequencies.
Here is a sound spectrum for the note G4 played on a flute (from our site on flute acoustics), which is convenient because the pitch of
this note corresponds approximately to a frequency of 400 Hz,
which is round number for approximate calculations.
The sound spectrum of the flute playing this note has a series of peaks
at frequencies of
400 Hz 800 Hz 1200 Hz 1600 Hz 2000 Hz 2400 Hz etc, which we can write as:
f 2f 3f 4f ... nf ... etc,
where f = 400 Hz is the fundamental frequency
of vibration of the air in the flute, and where n is
a whole number.
This series of frequencies is called the harmonic
series whose musical importance is discussed in some detail
in "The Science
of Music". The individual components with frequencies
nf are called the harmonics of the note.
The fundamental frequency of G4 is 400 Hz. This means
that the air in the flute is vibrating with a pattern that
repeats 400 times a second, or once every 1/400 seconds. This
time interval - the time it takes before a vibration repeats
- is called the period and it is given the symbol T.
Here the frequency f = 400 cycles per second (approximately) and the period
T = 1/400 second. In other words
T = 1/f.
where T is the period in seconds, and f the frequency in hertz.
In acoustics, it is useful to note that this equation works
too for frequency in kHz and period in ms.
If we were to look at the sound of a G4 tuning fork, we would
find that it vibrates at (approximately) 400 times per second.
Its vibration is particularly simple – it produces a smooth
sine wave pattern in the air, and its spectrum has only one
substantial peak, at (approximately) 400 Hz. You know that
the flute and the tuning fork sound different: one way in
which they are different is that they have a different vibration
pattern and a different spectrum. So let's get back to the
spectrum of the flute note and the harmonic series.
This is a harmonic spectrum, which has a special property, which we'll now examine.
Consider the harmonics of the flute note at
f 2f 3f 4f ... nf ,
The periods which correspond to these spectral components
are, using the equation given above:
T T/2 T/3 T/4 ... T/n .
Consider the second harmonic with frequency 2f. In one cycle
of the fundamental vibration (which takes a time T) the second
harmonic has exactly enough time for two vibrations.
The third harmonic has exactly enough time for three vibrations,
and the nth harmonic has exactly enough time for n vibrations.
Thus, at the end of the time T, all of these vibrations are
'ready' to start again, exactly in step. It follows that any
combination of vibrations which have frequencies made up of
the harmonic series (i.e. with f, 2f, 3f, 4f, .... nf) will
repeat exactly after a time T = 1/f. The harmonic series is
special because any combination of its vibrations produces
a periodic or repeated vibration at the fundamental frequency
f. This is shown in the example below.
Beofre we leave this example however, let's look between the harmonics. In both of the examples shown above, the spectrum is a continuous, non-zero line, so there is acoustic power at virtually all frequencies. In the case of the flute, this is the breathy or windy sound that is an important part of the characteristic sound of the instrument. In these examples, this broad band component in the spectrum is much weaker than the harmonic components. We shall concentrate below on the harmonic components, but the broad band components are important, too.
An example of an harmonic spectrum: the sawtooth wave
The graph below shows the first six harmonics of a sawtooth wave, named for its shape.
On the left is the (magnitude) spectrum, the amplitudes
of the different harmonics that we are going to add. The upper
right figure shows six sine waves, with frequency f, 2f, 3f
etc. The lower figure shows their sum. (As more and more components
are added, the figure more closely approaches the sawtooth
wave with its sharp points.)
|