 Resonances, bandwidths and acoustical impedance spectra of vocal tract and trachea Resonances, bandwidths and acoustical impedance spectra of vocal tract and trachea
This page gives a simplified introduction to measurements, with links to scientific papers.
Measurements under near ecological conditions; formants
Measurements of the vocal tract resonances and antiresonances
Acoustic losses
The zeroth resonance
The effect of the trachea
Limitations
Measurements under near ecological conditions; formants
The resonances of the vocal tract give rise to formants in speech (see What is a formant?). Using the formants, the resonance frequencies can often be estimated, with limited precision, from the sound of voiced speech. The resonant frequencies can be measured with reasonable precision under nearly ecological conditions using broadband excitation at the open mouth. We describe that technique on a separate page. The present page, showing results from the thesis of Noel Hanna, describes precise measurements of acoustical impedance spectra made under laboratory conditions.
Measurements of the vocal tract resonances and antiresonances
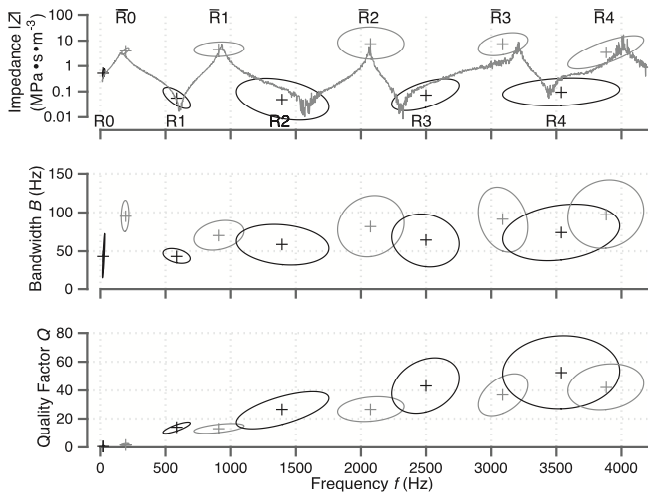
The three graphs below, from Hanna et al (2016), show acoustic impedance magnitude |Z|, bandwidth B and quality factor Q for each of the resonances (Ri, dark ellipses) and antiresonances (pale ellipses). The semiaxes show one standard deviation. In the top graph, the quasi-continuous superposed line is an example of one measurement of the |Z| spectrum. All measurements were made on men with their lips sealed around an impedance head (described here). More results (including results on women) are given by Hanna et al, 2016.
 . .
Acoustic losses
The top graph above shows that Z(f) is qualitatively somewhat similar to that of a closed duct of the same length. However, the measured bandwidth is larger and the Q smaller; the measurements are more comparable with a closed duct having acoustic losses about five times greater than the visco-thermal losses of a dry, rigid, smooth, closed duct.
 The zeroth resonance
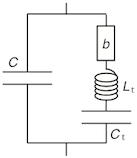
The lowest resonance (R0 ~ 20 Hz) is due to the inertance Lt of the mass of the tissue surrounding the tract in series with its own compliance Ct and loss b (the tissue vibrates on its own elasticity). The antiresonance (~ 200 Hz) is due to that circuit in parallel with the compliance C of the air in the tract (the tissue vibrates on the 'spring' of the air). (These may influence plosives: Wakita and Fant, 1978. STL-QPSR.(1):9-29.). For further details, again, see Hanna et al (2016).
The effect of the trachea
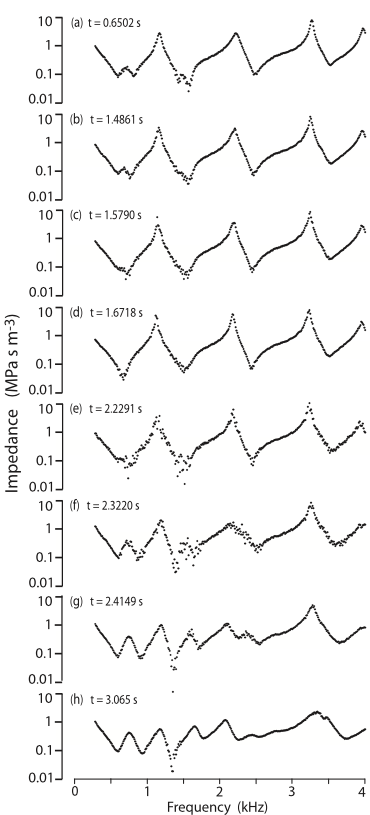
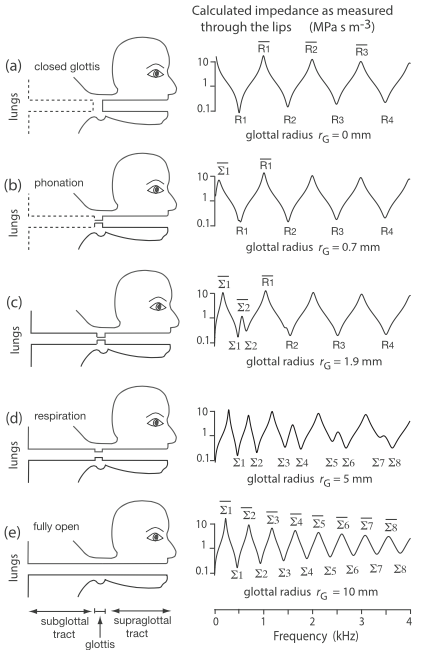
The graphs below shows |Z|(f) measured as the subject moved slowly from closed glottis to inspiration position. When the glottis is closed, the trachea does not interact with the vocal tract and, seen from the lips, the tract looks like a closed duct (as we saw above). As the glottis opens, the effective length of the duct is increased. The number of resonances and antiresonances in a given frequency range increases and their magnitudes decrease. A very simple model can be used:
For DC flow, the trachea leads to a termination closed at the alveoli. However, a few tens of cm below the glottis, the successive branching of the trachea gives a cross section that increases rapidly with distance from the glottis. In a very simple model, this can be approximated for AC currents as an open duct with an effective length of roughly 20 cm. So opening the glottis transforms the duct from a closed, 17 cm duct to an open 37 cm duct, roughly halving the frequency gap between resonances. The behaviour of this very simple model is shown in the other series of graphs shown below. Both figures are from Hanna et al (2018).
  . .
Limitations
For some applications, these measurements are 'from the wrong end' – it would be good to know the impedance spectrum seen from the glottis. This is not directly available for human subjects, but can be modelled. Papers from this team using Z(f) measurements
- Jeanneteau, M., Hanna, N., Almeida, A., Smith, J. and Wolfe, J. (2020) "Using visual feedback to tune the second vocal tract resonance for singing in the high soprano range", Logopedics Phoniatrics Vocology, DOI: 10.1080/14015439.2020.1834612
- Hanna, N., Smith J. and Wolfe, J. (2018) "How the acoustic resonances of the subglottal tract affect the impedance spectrum measured through the lips" J. Acoust. Soc. America, 143, 2639-2650.
- Hanna, N., Smith J. and Wolfe, J. (2016) "Frequencies, bandwidths and magnitudes of vocal tract and surrounding tissue resonances, measured through the lips during phonation" J. Acoust. Soc. America, 139, 2924–2936.
- Henrich Bernadoni, N., Smith, J. and Wolfe, J. (2014) "Vocal tract resonances in singing: variation with laryngeal mechanism for male operatic singers" J. Acoust. Soc. America. 135, 491-501.
- Bourne, T. and Garnier, M. (2012) "Physiological and acoustic characteristics of the female music theater voice" J. Acoust. Soc. America. 131, 1586-1594.
- Garnier, M., Henrich, N., Crevier-Buchman, L., Vincent, C., Smith, J. and Wolfe, J. (2012) "Glottal behavior in the high soprano range and the transition to the whistle register" J. Acoust. Soc. America. 131, 951-962.
- Henrich, N., Smith, J. and Wolfe, J. (2011) "Vocal tract resonances in singing: Strategies used by sopranos,
altos, tenors, and baritones" J. Acoust. Soc. America. 129, 1024-1035.
- Garnier, M., Henrich, N., Smith, J. and Wolfe, J. (2010) "Vocal tract adjustments in the high soprano range" J. Acoust. Soc. America. 127, 3771-3780.
- Swerdlin, Y., Smith, J. and Wolfe, J. (2010) "The effect of whisper and creak vocal mechanisms on vocal tract resonances" J. Acoust. Soc. America. 127, 2590-2598.
- Henrich, N., Kiek, M., Smith, J. and Wolfe, J. (2007) "Resonance strategies in Bulgarian women's singing", Logopedics Phoniatrics Vocology, 32, 171-177.
- Joliveau, E., Smith, J. and Wolfe, J. (2004) "Vocal
tract resonances in singing: the soprano voice", J.
Acoust. Soc. America, 116, 2434-2439.
- Joliveau, E., Smith, J. and Wolfe, J. (2004) "Tuning
of vocal tract resonances by sopranos", Nature, 427, 11
- Donaldson, T., Wang, D., Smith, J. and Wolfe, J. (2003)
"Vocal tract resonances: a preliminary study of sex differences
for young Australians", Acoustics Australia, 31, 95-98.
- Dr Malte Kob, in Aachen, developed a system
working on similar principles: Kob, M. and Neuschaefer-Rube, C. (2002) "A method for measurement of the vocal tract impedance at the mouth" Med. Eng. & Physics. 24, 467-471.
- Dowd, A., Smith, J.R. and Wolfe, J. (1998) "Learning
to pronounce vowel sounds in a foreign language using acoustic
measurements of the vocal tract as feedback in real time" Language and Speech, 41, 1-20.
- Epps, J., Smith, J.R. and Wolfe, J. (1997) "A novel instrument to measure acoustic resonances of the vocal tract during speech" Measurement Science and Technology 8, 1112-1121.
- J., Dowd, A., Smith, J.R. and Wolfe, J. (1997) Real
time measurements of the vocal tract resonances during speech Eurospeech'97 (G. Kokkinakis, N. Fakotakis &
E. Dermatas, eds.) Rhodes, 721-724.
|